Estimated Value: $61,000 - $112,000
1
Bed
1
Bath
1,158
Sq Ft
$74/Sq Ft
Est. Value
About This Home
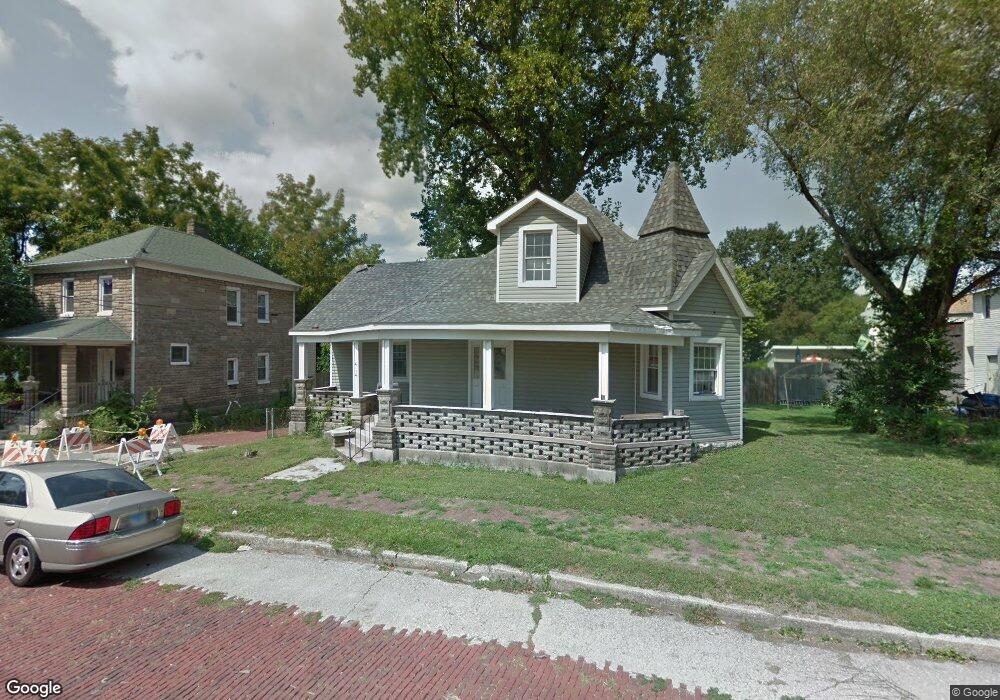
This home is located at 414 Spring St, Alton, IL 62002 and is currently estimated at $85,623, approximately $73 per square foot. 414 Spring St is a home located in Madison County with nearby schools including West Elementary School, Alton Middle School, and Alton High School.
Ownership History
Date
Name
Owned For
Owner Type
Purchase Details
Closed on
Aug 31, 2007
Sold by
Scheffel Christine M
Bought by
Scarborough Dennis E
Current Estimated Value
Home Financials for this Owner
Home Financials are based on the most recent Mortgage that was taken out on this home.
Original Mortgage
$21,240
Interest Rate
6.72%
Mortgage Type
Purchase Money Mortgage
Purchase Details
Closed on
Nov 10, 2005
Sold by
Scheffel Michael D
Bought by
Scheffel Christine M and Declaration Of Trust Of Christine M Sche
Purchase Details
Closed on
Mar 2, 2005
Sold by
Storm James O
Bought by
Scheffel Mike
Create a Home Valuation Report for This Property
The Home Valuation Report is an in-depth analysis detailing your home's value as well as a comparison with similar homes in the area
Home Values in the Area
Average Home Value in this Area
Purchase History
| Date | Buyer | Sale Price | Title Company |
|---|---|---|---|
| Scarborough Dennis E | $24,000 | Community Title & Escrow Ltd | |
| Scheffel Christine M | -- | -- | |
| Scheffel Mike | $5,000 | Mctc |
Source: Public Records
Mortgage History
| Date | Status | Borrower | Loan Amount |
|---|---|---|---|
| Previous Owner | Scarborough Dennis E | $21,240 |
Source: Public Records
Tax History
| Year | Tax Paid | Tax Assessment Tax Assessment Total Assessment is a certain percentage of the fair market value that is determined by local assessors to be the total taxable value of land and additions on the property. | Land | Improvement |
|---|---|---|---|---|
| 2024 | $272 | $10,540 | $2,170 | $8,370 |
| 2023 | $272 | $9,520 | $1,960 | $7,560 |
| 2022 | $805 | $8,600 | $1,770 | $6,830 |
| 2021 | $740 | $8,080 | $1,660 | $6,420 |
| 2020 | $723 | $7,790 | $1,600 | $6,190 |
| 2019 | $747 | $7,610 | $1,560 | $6,050 |
| 2018 | $727 | $7,410 | $1,520 | $5,890 |
| 2017 | $653 | $6,750 | $1,520 | $5,230 |
| 2016 | $640 | $6,750 | $1,520 | $5,230 |
| 2015 | $608 | $6,750 | $1,520 | $5,230 |
| 2014 | $608 | $6,750 | $1,520 | $5,230 |
| 2013 | $608 | $6,930 | $1,560 | $5,370 |
Source: Public Records
Map
Nearby Homes
Your Personal Tour Guide
Ask me questions while you tour the home.