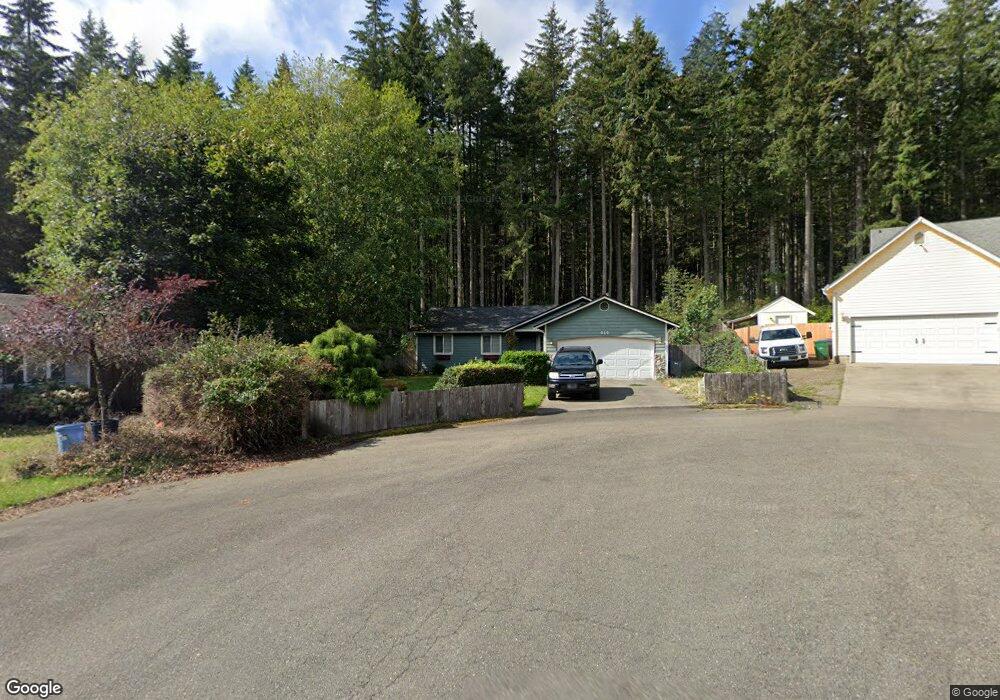
414 SW Bishop Ct Port Orchard, WA 98367
Estimated Value: $433,000 - $488,000
3
Beds
2
Baths
1,158
Sq Ft
$390/Sq Ft
Est. Value
About This Home
This home is located at 414 SW Bishop Ct, Port Orchard, WA 98367 and is currently estimated at $452,136, approximately $390 per square foot. 414 SW Bishop Ct is a home located in Kitsap County with nearby schools including Burley Glenwood Elementary School, Cedar Heights Middle School, and South Kitsap High School.
Ownership History
Date
Name
Owned For
Owner Type
Purchase Details
Closed on
Mar 24, 2008
Sold by
Marriage Austin J and Marriage Anastasia G
Bought by
Lazo Joseph L
Current Estimated Value
Home Financials for this Owner
Home Financials are based on the most recent Mortgage that was taken out on this home.
Original Mortgage
$234,000
Outstanding Balance
$145,622
Interest Rate
5.72%
Mortgage Type
Purchase Money Mortgage
Estimated Equity
$306,514
Purchase Details
Closed on
Dec 26, 2002
Sold by
Wilson David J and Wilson Cynthia M
Bought by
Marriage Austin J and Marriage Anastasia G
Home Financials for this Owner
Home Financials are based on the most recent Mortgage that was taken out on this home.
Original Mortgage
$153,510
Interest Rate
5.86%
Mortgage Type
VA
Purchase Details
Closed on
Jun 20, 1996
Sold by
Kitsap Cnty Consolidated Hsng Authority
Bought by
Wilson David J and Wilson Cynthia M
Home Financials for this Owner
Home Financials are based on the most recent Mortgage that was taken out on this home.
Original Mortgage
$83,800
Interest Rate
6.75%
Create a Home Valuation Report for This Property
The Home Valuation Report is an in-depth analysis detailing your home's value as well as a comparison with similar homes in the area
Home Values in the Area
Average Home Value in this Area
Purchase History
| Date | Buyer | Sale Price | Title Company |
|---|---|---|---|
| Lazo Joseph L | $234,280 | First American Title Ins Co | |
| Marriage Austin J | $150,500 | Land Title Company | |
| Wilson David J | -- | Land Title Company |
Source: Public Records
Mortgage History
| Date | Status | Borrower | Loan Amount |
|---|---|---|---|
| Open | Lazo Joseph L | $234,000 | |
| Previous Owner | Marriage Austin J | $153,510 | |
| Previous Owner | Wilson David J | $83,800 |
Source: Public Records
Tax History Compared to Growth
Tax History
| Year | Tax Paid | Tax Assessment Tax Assessment Total Assessment is a certain percentage of the fair market value that is determined by local assessors to be the total taxable value of land and additions on the property. | Land | Improvement |
|---|---|---|---|---|
| 2026 | $3,230 | $364,330 | $78,840 | $285,490 |
| 2025 | $3,230 | $364,330 | $78,840 | $285,490 |
| 2024 | $3,133 | $364,330 | $78,840 | $285,490 |
| 2023 | $3,111 | $364,330 | $78,840 | $285,490 |
| 2022 | $2,971 | $291,230 | $62,840 | $228,390 |
| 2021 | $2,825 | $261,940 | $57,130 | $204,810 |
| 2020 | $2,650 | $238,360 | $56,090 | $182,270 |
| 2019 | $2,248 | $221,280 | $51,840 | $169,440 |
| 2018 | $2,218 | $167,070 | $44,620 | $122,450 |
| 2017 | $1,877 | $167,070 | $44,620 | $122,450 |
| 2016 | $1,834 | $149,440 | $42,490 | $106,950 |
| 2015 | $1,773 | $146,340 | $42,490 | $103,850 |
| 2014 | -- | $162,470 | $59,030 | $103,440 |
| 2013 | -- | $162,470 | $59,030 | $103,440 |
Source: Public Records
Map
Nearby Homes
- 11676 Fry Ave SW
- 453 SW View Dr
- 11618 Sidney Rd SW
- 11291 Cooper Ave SW
- 11255 Ridge Rim Trail SE
- 10966 Branch Place SE
- 1204 SE Oak Rd
- 12524 Westbrook Dr SW
- 514 SW Hipkins Ct
- 10668 Bethel Burley Rd SE
- 10088 Fairview Blvd SW
- 146 XX Park Dr SE
- 145 XX Park Dr SE
- 10379 Bethel Burley Rd SE
- 1450 SE Spruce Rd
- 10569 Glenwood Rd SW
- 0 Silver Ln SW
- 9504 SW Caulfield Ln
- 10223 Glenwood Rd SW
- 15086 Burley Ave SE