Estimated Value: $77,000 - $151,000
3
Beds
2
Baths
1,654
Sq Ft
$65/Sq Ft
Est. Value
About This Home
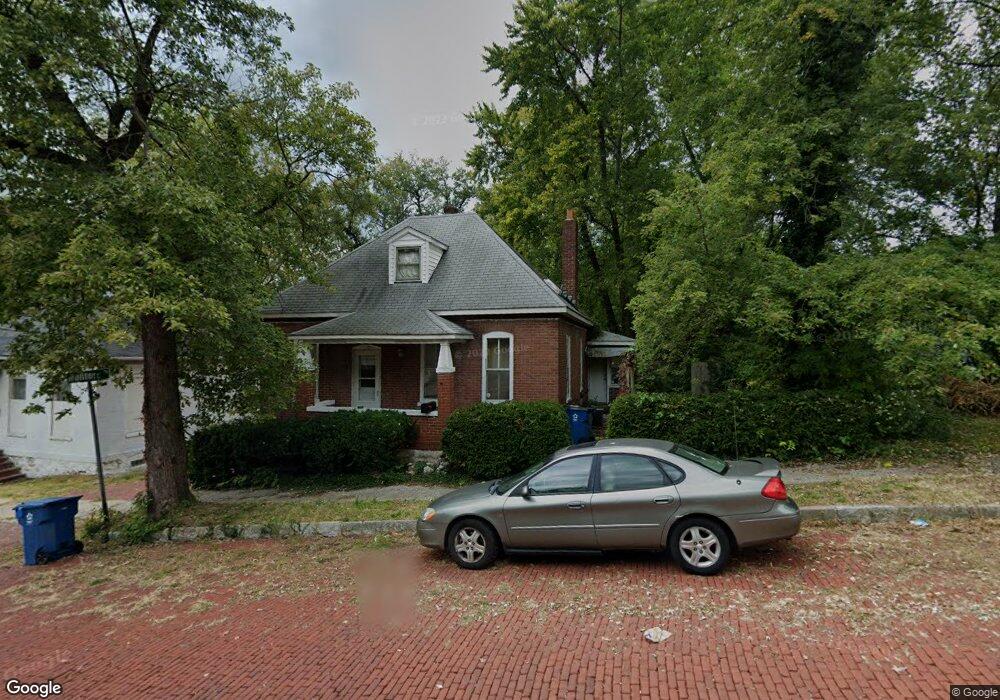
This home is located at 414 Vine St, Alton, IL 62002 and is currently estimated at $106,764, approximately $64 per square foot. 414 Vine St is a home located in Madison County with nearby schools including West Elementary School, Alton Middle School, and Alton High School.
Ownership History
Date
Name
Owned For
Owner Type
Purchase Details
Closed on
Sep 4, 2009
Sold by
Marchal Kella L
Bought by
Ratkewicz Alexander and Ratkewicz Allan E
Current Estimated Value
Home Financials for this Owner
Home Financials are based on the most recent Mortgage that was taken out on this home.
Original Mortgage
$70,695
Outstanding Balance
$46,422
Interest Rate
5.27%
Mortgage Type
FHA
Estimated Equity
$60,342
Purchase Details
Closed on
Sep 3, 2004
Sold by
Mueller Pamela E
Bought by
Marchal Glenn and Marchal Kella L
Purchase Details
Closed on
Jun 14, 2004
Sold by
Fluck John J and Hueller Pamela E
Bought by
Mueller Pamela E
Create a Home Valuation Report for This Property
The Home Valuation Report is an in-depth analysis detailing your home's value as well as a comparison with similar homes in the area
Home Values in the Area
Average Home Value in this Area
Purchase History
| Date | Buyer | Sale Price | Title Company |
|---|---|---|---|
| Ratkewicz Alexander | $72,000 | Community Title & Escrow Ltd | |
| Marchal Glenn | $30,000 | Serenity Title & Escrow Ltd | |
| Mueller Pamela E | -- | -- |
Source: Public Records
Mortgage History
| Date | Status | Borrower | Loan Amount |
|---|---|---|---|
| Open | Ratkewicz Alexander | $70,695 |
Source: Public Records
Tax History
| Year | Tax Paid | Tax Assessment Tax Assessment Total Assessment is a certain percentage of the fair market value that is determined by local assessors to be the total taxable value of land and additions on the property. | Land | Improvement |
|---|---|---|---|---|
| 2024 | $1,671 | $26,550 | $1,610 | $24,940 |
| 2023 | $1,671 | $23,970 | $1,450 | $22,520 |
| 2022 | $1,520 | $21,670 | $1,310 | $20,360 |
| 2021 | $1,316 | $20,360 | $1,230 | $19,130 |
| 2020 | $1,266 | $19,640 | $1,190 | $18,450 |
| 2019 | $1,295 | $19,190 | $1,160 | $18,030 |
| 2018 | $1,245 | $18,690 | $1,130 | $17,560 |
| 2017 | $1,228 | $18,690 | $1,130 | $17,560 |
| 2016 | $1,203 | $18,690 | $1,130 | $17,560 |
| 2015 | $1,157 | $18,690 | $1,130 | $17,560 |
| 2014 | $1,157 | $18,690 | $1,130 | $17,560 |
| 2013 | $1,157 | $19,200 | $1,160 | $18,040 |
Source: Public Records
Map
Nearby Homes
Your Personal Tour Guide
Ask me questions while you tour the home.