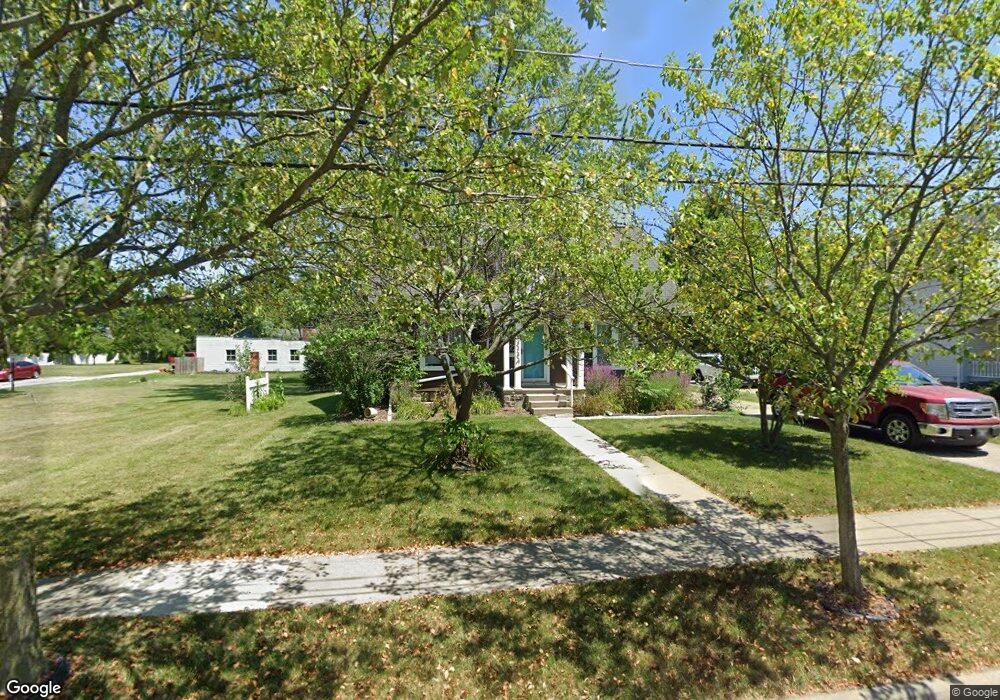
414 Vine St Unit A Archbold, OH 43502
Estimated Value: $171,000 - $219,000
4
Beds
2
Baths
1,331
Sq Ft
$140/Sq Ft
Est. Value
About This Home
This home is located at 414 Vine St Unit A, Archbold, OH 43502 and is currently estimated at $186,014, approximately $139 per square foot. 414 Vine St Unit A is a home located in Fulton County with nearby schools including Archbold Elementary School, Archbold Middle School, and Archbold High School.
Ownership History
Date
Name
Owned For
Owner Type
Purchase Details
Closed on
May 12, 2023
Sold by
Waidelich Britany J
Bought by
Mayfield Malcolm J
Current Estimated Value
Purchase Details
Closed on
Apr 1, 2022
Sold by
Rosario Sullivan P and Rosario Jane A
Bought by
Mayfield Malcolm J
Purchase Details
Closed on
May 17, 2000
Sold by
Smith Jason J
Bought by
Rosario Sullivan P and Rosario Jane A
Home Financials for this Owner
Home Financials are based on the most recent Mortgage that was taken out on this home.
Original Mortgage
$93,200
Interest Rate
8.21%
Mortgage Type
FHA
Purchase Details
Closed on
Jan 1, 1990
Bought by
Britsch Herman D
Create a Home Valuation Report for This Property
The Home Valuation Report is an in-depth analysis detailing your home's value as well as a comparison with similar homes in the area
Home Values in the Area
Average Home Value in this Area
Purchase History
We collect this data history from publicly available records. To have your information removed, we recommend requesting removal directly through your county’s website.
| Date | Buyer | Sale Price | Title Company |
|---|---|---|---|
| Mayfield Malcolm J | -- | None Listed On Document | |
| Mayfield Malcolm J | -- | Winzeler & Bok Ltd | |
| Mayfield Malcolm J | -- | None Listed On Document | |
| Rosario Sullivan P | $94,000 | -- | |
| Britsch Herman D | -- | -- |
Source: Public Records
Mortgage History
We collect this data history from publicly available records. To have your information removed, we recommend requesting removal directly through your county’s website.
| Date | Status | Borrower | Loan Amount |
|---|---|---|---|
| Previous Owner | Rosario Sullivan P | $93,200 |
Source: Public Records
Tax History
| Year | Tax Paid | Tax Assessment Tax Assessment Total Assessment is a certain percentage of the fair market value that is determined by local assessors to be the total taxable value of land and additions on the property. | Land | Improvement |
|---|---|---|---|---|
| 2025 | $2,041 | $39,170 | $9,630 | $29,540 |
| 2024 | $2,041 | $39,170 | $9,630 | $29,540 |
| 2023 | $2,060 | $39,170 | $9,630 | $29,540 |
| 2022 | $1,555 | $31,860 | $8,020 | $23,840 |
| 2021 | $1,284 | $26,290 | $8,020 | $18,270 |
| 2020 | $1,278 | $26,290 | $8,020 | $18,270 |
| 2019 | $1,173 | $23,000 | $8,020 | $14,980 |
| 2018 | $1,057 | $23,000 | $8,020 | $14,980 |
| 2017 | $1,027 | $23,000 | $8,020 | $14,980 |
| 2016 | $1,047 | $21,570 | $8,020 | $13,550 |
| 2015 | $917 | $21,570 | $8,020 | $13,550 |
| 2014 | $917 | $21,570 | $8,020 | $13,550 |
| 2013 | $1,071 | $24,020 | $6,970 | $17,050 |
Source: Public Records
Map
Nearby Homes
- 205 Vine St
- 0 Cedar Grove Ct Unit 45
- 404 Park St
- 433 Primrose Ln
- 909 Monterey Ct
- 501 Quail Run
- 808 West St
- 109 W Lugbill Rd
- 102 Monumental St
- 22850 Burlington Gardens St
- 1444 County Road 20
- V-526 Co Rd 25
- 24047 State Route 34
- 17830 County Road C
- 18857 U S 20a
- 26422 County Road J
- 107 Johnson Ave
- 307 E Curtis St
- 106 W Lynn St
- 102 W Lynn St
Your Personal Tour Guide
Ask me questions while you tour the home.