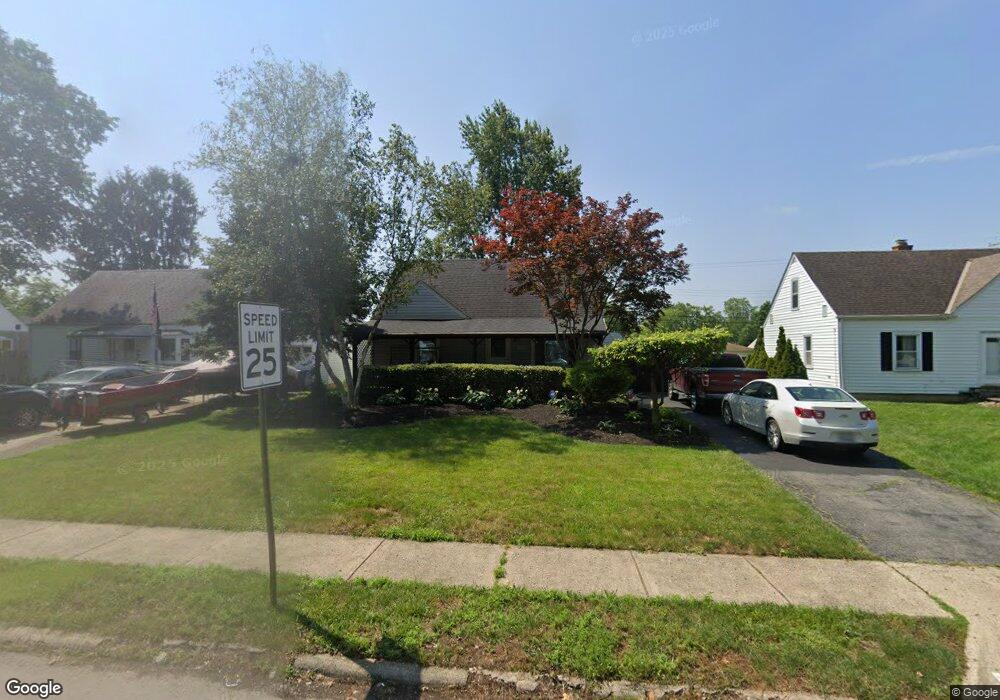
4141 Andrus Ave Columbus, OH 43227
Estimated Value: $199,086 - $256,000
3
Beds
2
Baths
1,372
Sq Ft
$167/Sq Ft
Est. Value
About This Home
This home is located at 4141 Andrus Ave, Columbus, OH 43227 and is currently estimated at $229,772, approximately $167 per square foot. 4141 Andrus Ave is a home located in Franklin County with nearby schools including Etna Road Elementary School, Beechwood Elementary School, and Rosemore Middle School.
Ownership History
Date
Name
Owned For
Owner Type
Purchase Details
Closed on
Oct 19, 2021
Sold by
Haynes Dino
Bought by
Haynes Dino and Haynes Linda S
Current Estimated Value
Home Financials for this Owner
Home Financials are based on the most recent Mortgage that was taken out on this home.
Original Mortgage
$119,200
Outstanding Balance
$109,089
Interest Rate
3.05%
Mortgage Type
New Conventional
Estimated Equity
$120,683
Purchase Details
Closed on
Aug 25, 2000
Sold by
Chrisman Nancy F
Bought by
Stewart Eric D
Home Financials for this Owner
Home Financials are based on the most recent Mortgage that was taken out on this home.
Original Mortgage
$76,431
Interest Rate
8.12%
Mortgage Type
FHA
Purchase Details
Closed on
Jun 26, 1963
Bought by
Chrisman Donald R
Create a Home Valuation Report for This Property
The Home Valuation Report is an in-depth analysis detailing your home's value as well as a comparison with similar homes in the area
Home Values in the Area
Average Home Value in this Area
Purchase History
| Date | Buyer | Sale Price | Title Company |
|---|---|---|---|
| Haynes Dino | -- | Equity Settlement Svcs Inc | |
| Stewart Eric D | $76,500 | Transohio Title | |
| Chrisman Donald R | -- | -- |
Source: Public Records
Mortgage History
| Date | Status | Borrower | Loan Amount |
|---|---|---|---|
| Open | Haynes Dino | $119,200 | |
| Closed | Stewart Eric D | $76,431 |
Source: Public Records
Tax History Compared to Growth
Tax History
| Year | Tax Paid | Tax Assessment Tax Assessment Total Assessment is a certain percentage of the fair market value that is determined by local assessors to be the total taxable value of land and additions on the property. | Land | Improvement |
|---|---|---|---|---|
| 2024 | $2,725 | $62,340 | $16,210 | $46,130 |
| 2023 | $2,706 | $62,340 | $16,210 | $46,130 |
| 2022 | $2,023 | $35,420 | $6,650 | $28,770 |
| 2021 | $1,900 | $35,420 | $6,650 | $28,770 |
| 2020 | $1,881 | $35,420 | $6,650 | $28,770 |
| 2019 | $1,693 | $27,720 | $5,320 | $22,400 |
| 2018 | $1,730 | $27,720 | $5,320 | $22,400 |
| 2017 | $1,635 | $27,720 | $5,320 | $22,400 |
| 2016 | $1,720 | $26,330 | $5,010 | $21,320 |
| 2015 | $1,734 | $26,330 | $5,010 | $21,320 |
| 2014 | $1,735 | $26,330 | $5,010 | $21,320 |
| 2013 | $917 | $29,260 | $5,565 | $23,695 |
Source: Public Records
Map
Nearby Homes
- 4144 Mcallister Ave
- 963 Erickson Ave
- 4094 E Main St
- 3955 E Fulton St
- 3945 Dillon Dr
- 4199 Wright Park
- 798 S Yearling Rd
- 1220 Elderwood Ave
- 931 E Fulton St
- 4363 E Mound St
- 1291 Westphal Ave
- 1294 Dellwood Ave
- 1068 Ross Rd
- 1085 S Hamilton Rd
- 4181 Colby Ave
- 3811 Brentwood Ct
- 4295 Colby Ave
- 1281 Maetzel Dr
- 1490 Elaine Rd Unit 1462
- 3598 Astor Ave
- 4133 Andrus Ave
- 4149 Andrus Ave
- 4123 Andrus Ave
- 4157 Andrus Ave
- 4108 E Mound St
- 4100 E Mound St
- 4116 E Mound St
- 1018 Rose Place
- 4092 E Mound St
- 4122 E Mound St
- 4115 Andrus Ave
- 4163 Andrus Ave
- 4086 E Mound St
- 1025 S Yearling Rd
- 1010 Rose Place
- 0 E Mound St
- 1073 S Yearling Rd
- 1015 Rose Place
- 4107 Andrus Ave
- 4078 E Mound St