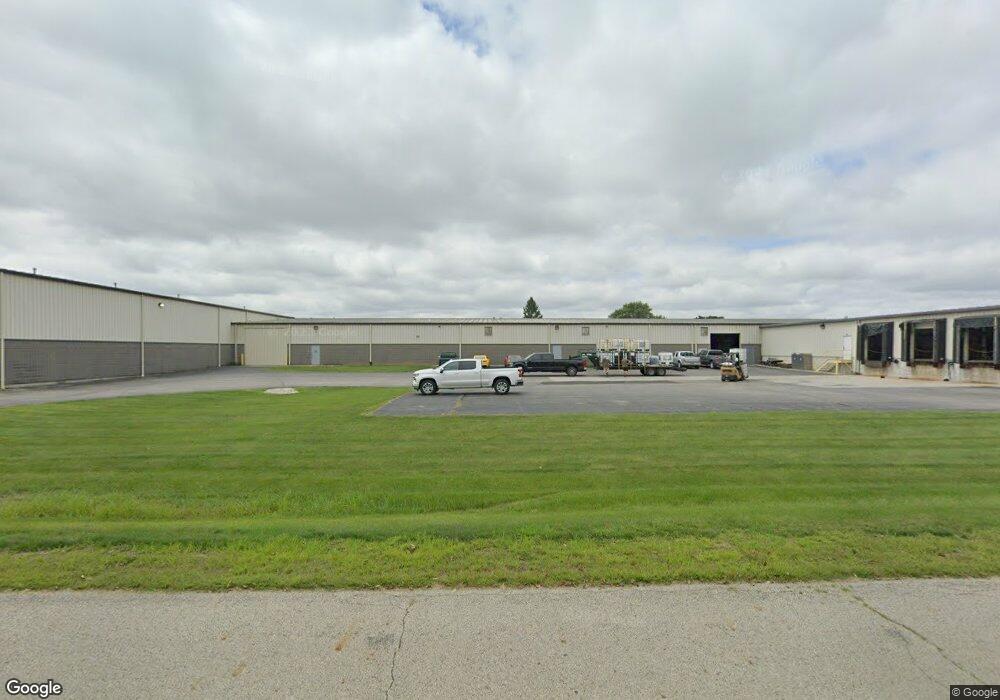
4141 Laybourne Rd Springfield, OH 45505
Estimated Value: $2,077,382
Studio
--
Bath
56,556
Sq Ft
$37/Sq Ft
Est. Value
About This Home
This home is located at 4141 Laybourne Rd, Springfield, OH 45505 and is currently estimated at $2,077,382, approximately $36 per square foot. 4141 Laybourne Rd is a home located in Clark County with nearby schools including Possum Elementary School, Shawnee Middle School/High School, and Nightingale Montessori School.
Ownership History
Date
Name
Owned For
Owner Type
Purchase Details
Closed on
Oct 12, 2009
Sold by
New Micro Holdings Llc
Bought by
Kova Fertilizer Inc
Current Estimated Value
Purchase Details
Closed on
Nov 21, 2000
Sold by
Micro Enterprises Inc
Bought by
New Micro Holdings Llc
Home Financials for this Owner
Home Financials are based on the most recent Mortgage that was taken out on this home.
Original Mortgage
$2,686,500
Interest Rate
7.87%
Mortgage Type
Commercial
Purchase Details
Closed on
Dec 30, 1994
Sold by
Chatfield William D
Bought by
Micro Enterprises
Home Financials for this Owner
Home Financials are based on the most recent Mortgage that was taken out on this home.
Original Mortgage
$1,100,000
Interest Rate
9.24%
Mortgage Type
Commercial
Create a Home Valuation Report for This Property
The Home Valuation Report is an in-depth analysis detailing your home's value as well as a comparison with similar homes in the area
Home Values in the Area
Average Home Value in this Area
Purchase History
| Date | Buyer | Sale Price | Title Company |
|---|---|---|---|
| Kova Fertilizer Inc | $930,000 | Attorney | |
| New Micro Holdings Llc | $1,585,000 | Chicago Title Insurance Comp | |
| Micro Enterprises | $870,268 | -- |
Source: Public Records
Mortgage History
| Date | Status | Borrower | Loan Amount |
|---|---|---|---|
| Previous Owner | New Micro Holdings Llc | $2,686,500 | |
| Previous Owner | Micro Enterprises | $1,100,000 | |
| Closed | New Micro Holdings Llc | $750,000 |
Source: Public Records
Tax History
| Year | Tax Paid | Tax Assessment Tax Assessment Total Assessment is a certain percentage of the fair market value that is determined by local assessors to be the total taxable value of land and additions on the property. | Land | Improvement |
|---|---|---|---|---|
| 2025 | $38,504 | $656,190 | $85,040 | $571,150 |
| 2024 | $37,656 | $555,860 | $60,740 | $495,120 |
| 2023 | $37,656 | $555,860 | $60,740 | $495,120 |
| 2022 | $37,011 | $555,860 | $60,740 | $495,120 |
| 2021 | $39,032 | $555,860 | $60,740 | $495,120 |
| 2020 | $39,277 | $555,860 | $60,740 | $495,120 |
| 2019 | $39,859 | $555,860 | $60,740 | $495,120 |
| 2018 | $37,205 | $521,250 | $55,220 | $466,030 |
| 2017 | $36,172 | $491,849 | $55,220 | $436,629 |
| 2016 | $32,636 | $491,849 | $55,220 | $436,629 |
| 2015 | $16,637 | $491,849 | $55,220 | $436,629 |
| 2014 | $32,997 | $491,849 | $55,220 | $436,629 |
| 2013 | $14,549 | $491,849 | $55,220 | $436,629 |
Source: Public Records
Map
Nearby Homes
- 2164 Ridge Rd
- 2212 Ridge Rd
- 801 S Bird Rd
- 0 Fletcher Chapel Rd Unit 1042048
- 413 S Landon Ln
- 414 S Landon Ln
- 2800 Craig Rd
- 410 S Landon Ln
- 2076 Stowe Dr
- 2076-2078 Stowe Dr
- 4205 Altman Ave
- Emmett Plan at Melody Parks - Designer Collection
- Carrington Plan at Melody Parks - Designer Collection
- Wyatt Plan at Melody Parks - Designer Collection
- Grandin Plan at Melody Parks - Designer Collection
- Avery Plan at Melody Parks - Designer Collection
- Calvin Plan at Melody Parks - Designer Collection
- Charles Plan at Melody Parks - Designer Collection
- Blair Plan at Melody Parks - Designer Collection
- Winston Plan at Melody Parks - Designer Collection
- 4141 Laybourne Rd
- 4005 Laybourne Rd
- 3975 Laybourne Rd
- 3901 Laybourne Rd
- 2060 Ridge Rd
- 2080 Ridge Rd
- 2028 Ridge Rd
- 2138 Ridge Rd
- 1876 Ridge Rd
- 2230 Ridge Rd
- 2260 Ridge Rd
- 2300 Ridge Rd
- 2330 Ridge Rd
- 2360 Ridge Rd
- 1614 S Bird Rd
- 4830 S Charleston Pike
- 4840 S Charleston Pike
- 4115 S Charleston Pike
- 4105 S Charleston Pike
- 1600 S Bird Rd