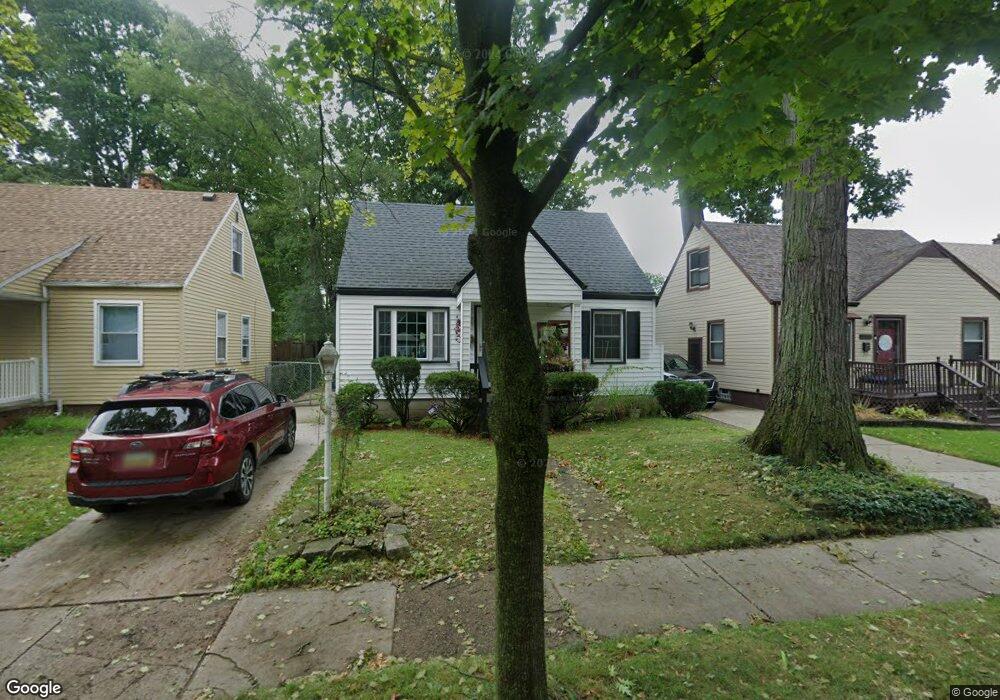
4141 Westpoint St Dearborn Heights, MI 48125
Estimated Value: $114,000 - $159,000
2
Beds
1
Bath
711
Sq Ft
$207/Sq Ft
Est. Value
About This Home
This home is located at 4141 Westpoint St, Dearborn Heights, MI 48125 and is currently estimated at $147,179, approximately $207 per square foot. 4141 Westpoint St is a home located in Wayne County with nearby schools including Polk Elementary School, Bedford School, and Pardee School.
Ownership History
Date
Name
Owned For
Owner Type
Purchase Details
Closed on
Oct 15, 2015
Sold by
Randall Joseph
Bought by
Shaw Jamison
Current Estimated Value
Home Financials for this Owner
Home Financials are based on the most recent Mortgage that was taken out on this home.
Original Mortgage
$61,750
Outstanding Balance
$25,045
Interest Rate
3.88%
Mortgage Type
New Conventional
Estimated Equity
$122,134
Purchase Details
Closed on
Jun 11, 2009
Sold by
Wtotw Homes Llc
Bought by
Randall Joseph
Purchase Details
Closed on
Jun 8, 2009
Sold by
Donovan Shaun
Bought by
Wtotw Homes Llc
Purchase Details
Closed on
Nov 6, 2007
Sold by
Mortgage Electronic Registration Systems
Bought by
Hud
Purchase Details
Closed on
Apr 26, 2007
Sold by
Calnan Joseph L and Copado Dorothy
Bought by
Mortgage Electronic Registration Systems
Purchase Details
Closed on
Sep 13, 2005
Sold by
Lapham Louis Samuel and Lapham Daryl Scott
Bought by
Calnan Joseph L
Create a Home Valuation Report for This Property
The Home Valuation Report is an in-depth analysis detailing your home's value as well as a comparison with similar homes in the area
Home Values in the Area
Average Home Value in this Area
Purchase History
| Date | Buyer | Sale Price | Title Company |
|---|---|---|---|
| Shaw Jamison | $65,000 | Title Source Inc | |
| Randall Joseph | $19,750 | None Available | |
| Wtotw Homes Llc | $10,001 | None Available | |
| Hud | -- | None Available | |
| Mortgage Electronic Registration Systems | $80,000 | None Available | |
| Calnan Joseph L | $84,460 | Multiple |
Source: Public Records
Mortgage History
| Date | Status | Borrower | Loan Amount |
|---|---|---|---|
| Open | Shaw Jamison | $61,750 |
Source: Public Records
Tax History Compared to Growth
Tax History
| Year | Tax Paid | Tax Assessment Tax Assessment Total Assessment is a certain percentage of the fair market value that is determined by local assessors to be the total taxable value of land and additions on the property. | Land | Improvement |
|---|---|---|---|---|
| 2025 | $1,190 | $68,500 | $0 | $0 |
| 2024 | $1,190 | $62,000 | $0 | $0 |
| 2023 | $1,125 | $53,400 | $0 | $0 |
| 2022 | $1,565 | $46,400 | $0 | $0 |
| 2021 | $1,568 | $41,600 | $0 | $0 |
| 2019 | $1,517 | $34,400 | $0 | $0 |
| 2018 | $1,019 | $30,000 | $0 | $0 |
| 2017 | $922 | $27,400 | $0 | $0 |
| 2016 | $1,453 | $25,900 | $0 | $0 |
| 2015 | $2,388 | $24,000 | $0 | $0 |
| 2013 | $2,440 | $25,300 | $0 | $0 |
| 2010 | -- | $30,900 | $0 | $0 |
Source: Public Records
Map
Nearby Homes
- 4193 Cornell St
- 4155 Syracuse St
- 4489 Westpoint St
- 4474 Syracuse St
- 3841 Westpoint St
- 4506 Syracuse St
- 3925 Madison St
- 4449 Academy St
- 4665 Syracuse St
- 4901 Cornell St
- 24337 Ross St
- 24409 Stanford St
- 3604 Syracuse St
- 24426 Lehigh St
- 3756 Grindley Park St
- 24313 Carlysle St
- 24117 Eton Ave
- 24635 Stanford St
- 24339 Eton Ave
- 4459 Parker St
- 4149 Westpoint St
- 4133 Westpoint St
- 4157 Westpoint St
- 4125 Westpoint St
- 4165 Westpoint St
- 4117 Westpoint St
- 4152 Cornell St
- 4140 Cornell St
- 4173 Westpoint St
- 4160 Cornell St
- 4126 Cornell St
- 4101 Westpoint St
- 4168 Cornell St
- 4118 Cornell St
- 4144 Westpoint St
- 4181 Westpoint St
- 4136 Westpoint St
- 4152 Westpoint St
- 4176 Cornell St
- 4128 Westpoint St