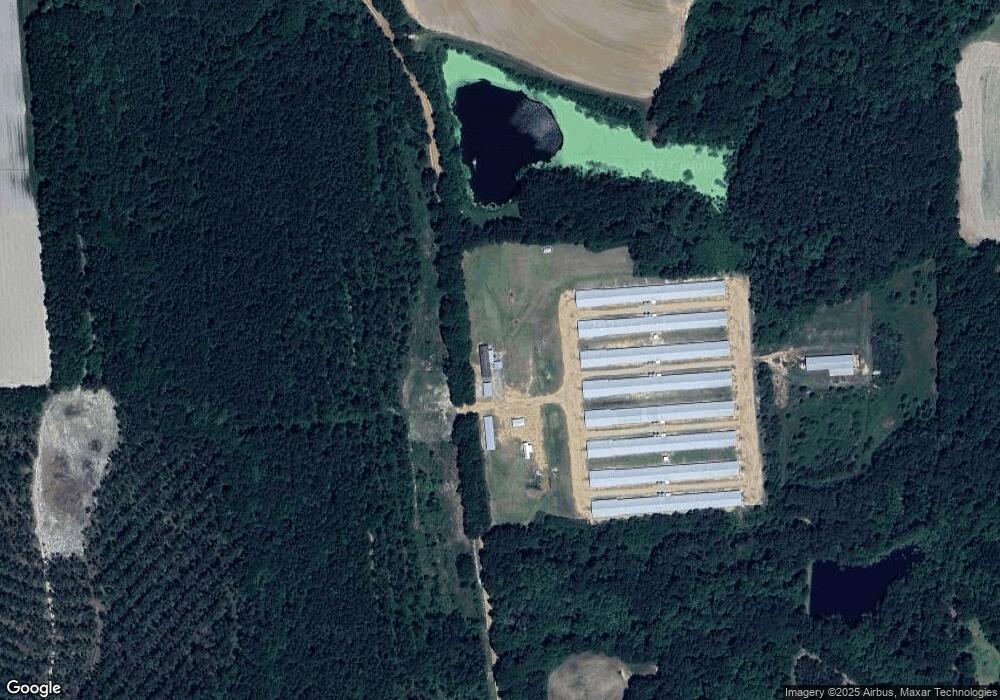
4142 Old Albany Rd Doerun, GA 31744
Estimated Value: $37,000 - $5,652,008
4
Beds
3
Baths
2,052
Sq Ft
$973/Sq Ft
Est. Value
About This Home
This home is located at 4142 Old Albany Rd, Doerun, GA 31744 and is currently estimated at $1,996,336, approximately $972 per square foot. 4142 Old Albany Rd is a home located in Colquitt County with nearby schools including Doerun Elementary School, C.A. Gray Junior High School, and Willie J. Williams Middle School.
Ownership History
Date
Name
Owned For
Owner Type
Purchase Details
Closed on
Oct 10, 2014
Sold by
Tn Investment Partner Llc
Bought by
Sl Poultry Farm Llc
Current Estimated Value
Home Financials for this Owner
Home Financials are based on the most recent Mortgage that was taken out on this home.
Original Mortgage
$1,955,000
Interest Rate
4.07%
Mortgage Type
New Conventional
Purchase Details
Closed on
Jul 23, 2008
Sold by
Nguyen Alan P
Bought by
Tn Investment Partner Llc
Home Financials for this Owner
Home Financials are based on the most recent Mortgage that was taken out on this home.
Original Mortgage
$1,680,000
Interest Rate
6.43%
Mortgage Type
New Conventional
Purchase Details
Closed on
Aug 5, 2005
Sold by
Smith Dykes C
Bought by
Nguyen Alan
Create a Home Valuation Report for This Property
The Home Valuation Report is an in-depth analysis detailing your home's value as well as a comparison with similar homes in the area
Home Values in the Area
Average Home Value in this Area
Purchase History
| Date | Buyer | Sale Price | Title Company |
|---|---|---|---|
| Sl Poultry Farm Llc | $2,300,000 | -- | |
| Tn Investment Partner Llc | $2,100,000 | -- | |
| Nguyen Alan | $180,000 | -- |
Source: Public Records
Mortgage History
| Date | Status | Borrower | Loan Amount |
|---|---|---|---|
| Closed | Sl Poultry Farm Llc | $1,955,000 | |
| Closed | Sl Poultry Farm Llc | $167,362 | |
| Previous Owner | Tn Investment Partner Llc | $1,680,000 | |
| Closed | Nguyen Alan | $0 |
Source: Public Records
Tax History Compared to Growth
Tax History
| Year | Tax Paid | Tax Assessment Tax Assessment Total Assessment is a certain percentage of the fair market value that is determined by local assessors to be the total taxable value of land and additions on the property. | Land | Improvement |
|---|---|---|---|---|
| 2024 | $9,296 | $462,199 | $77,926 | $384,273 |
| 2023 | $9,438 | $447,827 | $77,926 | $369,901 |
| 2022 | $9,288 | $442,104 | $76,816 | $365,288 |
| 2021 | $9,244 | $423,592 | $67,184 | $356,408 |
| 2020 | $9,312 | $420,220 | $67,184 | $353,036 |
| 2019 | $10,282 | $417,972 | $67,184 | $350,788 |
| 2018 | $10,691 | $417,972 | $67,184 | $350,788 |
| 2017 | $10,008 | $402,005 | $51,217 | $350,788 |
| 2016 | -- | $402,005 | $51,217 | $350,788 |
| 2015 | -- | $402,005 | $51,217 | $350,788 |
| 2014 | -- | $396,842 | $51,217 | $345,625 |
| 2013 | -- | $0 | $0 | $0 |
Source: Public Records
Map
Nearby Homes
- 512 Hagin Still Rd
- 340 Belk Rd
- 318 E Culpepper Ave
- 104 Union Ln
- 825 N Green St
- 417 W Bay Ave
- 511 W Broad Ave
- 715 W Robinson Ave
- 2329 Evergreen Rd
- 330/332 Debbie Ln
- 0 Sam Sells Rd
- 441 Weaver Rd
- 378 Old S R 33
- 1791 Funston Sigsbee Rd
- 102 Schley Church Rd
- 218 Gusty Rd
- 1485 Bay Rd
- 178 Cool Breeze Dr
- 00 Rossman Dairy Rd
- 4409 Georgia 112
- 658 Ga Highway 270 E
- 449 Tv Tower Rd
- 970 Ga Highway 270 E
- 610 Ga Highway 270 E
- 648 Ga Highway 270 E
- 696 Ga Highway 270 E
- 846 Ga Highway 270 E
- 1000 Ga Highway 270 E
- 614 Ga Highway 270 E
- 556 Ga Highway 270 E
- 785 Ga Highway 270 E
- 4555 Old Albany Rd
- 931 Georgia 270
- 931 Ga Highway 270 E
- 426 Tv Tower Rd
- 969 Ga Highway 270 E
- 885 Ga Highway 270 E
- 909 Ga Highway 270 E
- 3780 Old Albany Rd
- 3760 Old Albany Rd