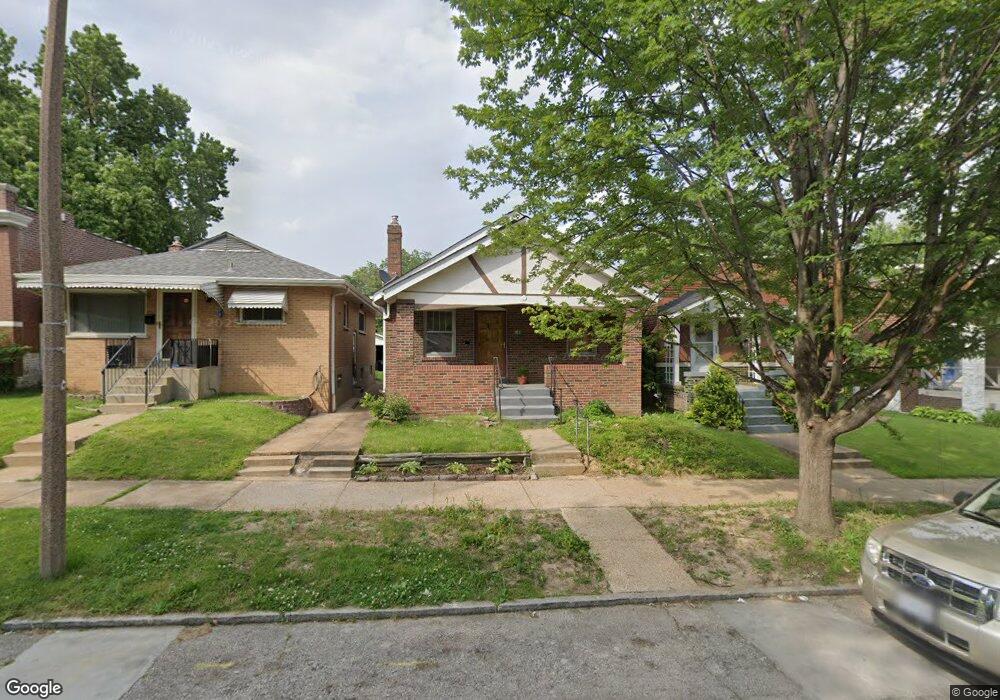
4143 Walsh St Saint Louis, MO 63116
Bevo Mill NeighborhoodEstimated Value: $88,000 - $134,000
1
Bed
1
Bath
816
Sq Ft
$130/Sq Ft
Est. Value
About This Home
This home is located at 4143 Walsh St, Saint Louis, MO 63116 and is currently estimated at $106,103, approximately $130 per square foot. 4143 Walsh St is a home located in St. Louis City with nearby schools including Woerner Elementary School, Long International Middle School, and Roosevelt High School.
Ownership History
Date
Name
Owned For
Owner Type
Purchase Details
Closed on
Apr 2, 2009
Sold by
Secretary Of Housing & Urban Development
Bought by
Feicht John E
Current Estimated Value
Purchase Details
Closed on
Jan 3, 2005
Sold by
Madden Meghan C
Bought by
Stock Edward W and Sueme Ann
Home Financials for this Owner
Home Financials are based on the most recent Mortgage that was taken out on this home.
Original Mortgage
$104,545
Interest Rate
5.74%
Mortgage Type
FHA
Purchase Details
Closed on
Dec 6, 2002
Sold by
Sendic Mirsad and Sendic Rasima
Bought by
Madden Meghan C
Home Financials for this Owner
Home Financials are based on the most recent Mortgage that was taken out on this home.
Original Mortgage
$79,373
Interest Rate
5.89%
Mortgage Type
FHA
Purchase Details
Closed on
Jul 23, 1998
Sold by
Edmunds Linda G and Edmunds Linda G
Bought by
Sendic Mirsad and Sendic Rasima
Home Financials for this Owner
Home Financials are based on the most recent Mortgage that was taken out on this home.
Original Mortgage
$42,408
Interest Rate
6.94%
Mortgage Type
FHA
Create a Home Valuation Report for This Property
The Home Valuation Report is an in-depth analysis detailing your home's value as well as a comparison with similar homes in the area
Home Values in the Area
Average Home Value in this Area
Purchase History
| Date | Buyer | Sale Price | Title Company |
|---|---|---|---|
| Feicht John E | -- | First American Title Ins Co | |
| Stock Edward W | -- | U S Title | |
| Madden Meghan C | -- | -- | |
| Sendic Mirsad | -- | -- |
Source: Public Records
Mortgage History
| Date | Status | Borrower | Loan Amount |
|---|---|---|---|
| Previous Owner | Stock Edward W | $104,545 | |
| Previous Owner | Madden Meghan C | $79,373 | |
| Previous Owner | Sendic Mirsad | $42,408 |
Source: Public Records
Tax History Compared to Growth
Tax History
| Year | Tax Paid | Tax Assessment Tax Assessment Total Assessment is a certain percentage of the fair market value that is determined by local assessors to be the total taxable value of land and additions on the property. | Land | Improvement |
|---|---|---|---|---|
| 2025 | $447 | $5,540 | $1,140 | $4,400 |
| 2024 | $426 | $5,000 | $1,140 | $3,860 |
| 2023 | $426 | $5,000 | $1,140 | $3,860 |
| 2022 | $412 | $4,650 | $1,140 | $3,510 |
| 2021 | $412 | $4,650 | $1,140 | $3,510 |
| 2020 | $379 | $4,280 | $1,140 | $3,140 |
| 2019 | $377 | $4,280 | $1,140 | $3,140 |
| 2018 | $359 | $3,930 | $1,140 | $2,790 |
| 2017 | $353 | $3,930 | $1,140 | $2,790 |
| 2016 | $352 | $3,860 | $1,140 | $2,720 |
| 2015 | $321 | $3,860 | $1,140 | $2,720 |
| 2014 | $334 | $3,860 | $1,140 | $2,720 |
| 2013 | -- | $4,030 | $1,140 | $2,890 |
Source: Public Records
Map
Nearby Homes
- 4163 Walsh St
- 4177 Walsh St
- 4045 Walsh St
- 4201 Walsh St
- 5019 Alexander St
- 4171 Eichelberger St
- 4729 Adkins Ave
- 4028 Schiller Place
- 4642 Steffens Ave
- 4010 Schiller Place
- 4639 Adkins Ave
- 3934 Randall St
- 4321 Bates St
- 3904 Walsh St
- 4552 Ray Ave
- 4217 Gannett St
- 3915 Schiller Place
- 4080 Burgen Ave
- 3910 Schiller Place
- 4215 Neosho St