Estimated Value: $56,000 - $298,000
--
Bed
--
Bath
952
Sq Ft
$180/Sq Ft
Est. Value
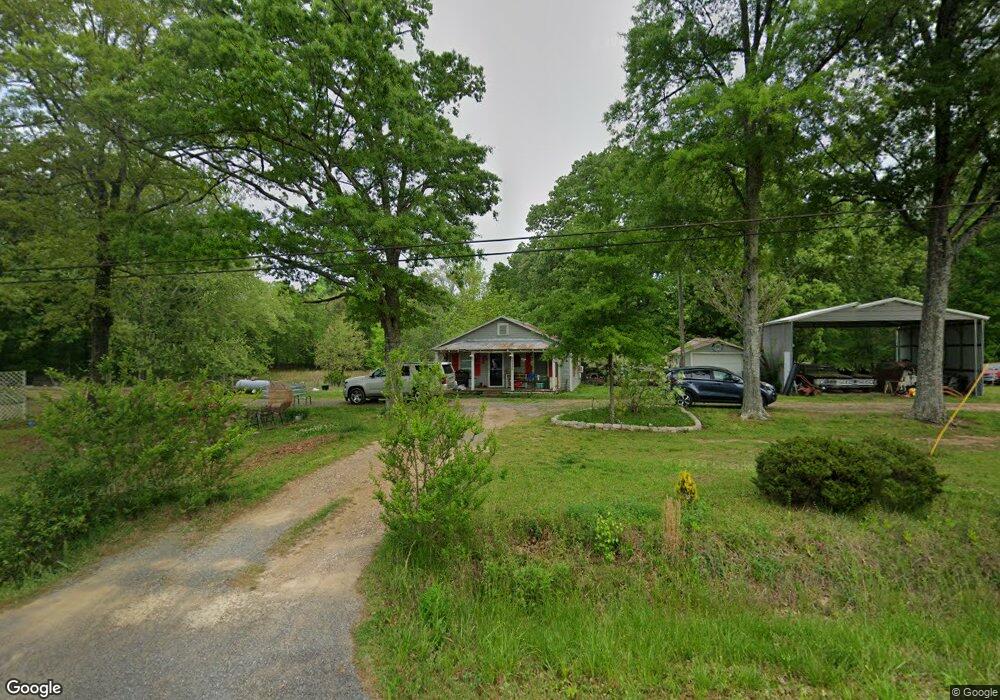
About This Home
This home is located at 4144 Blacks Bluff Rd SW, Rome, GA 30161 and is currently estimated at $171,588, approximately $180 per square foot. 4144 Blacks Bluff Rd SW is a home located in Floyd County with nearby schools including Coosa Middle School and Coosa High School.
Ownership History
Date
Name
Owned For
Owner Type
Purchase Details
Closed on
Oct 9, 2002
Sold by
Radke Ronald E
Bought by
Pruitt William
Current Estimated Value
Purchase Details
Closed on
Oct 4, 2002
Bought by
P and R
Purchase Details
Closed on
Mar 27, 1996
Sold by
Johnson Betty
Bought by
Radke Ronald E
Purchase Details
Closed on
Nov 11, 1994
Sold by
Johnson James Kenneth
Bought by
Johnson Betty
Purchase Details
Closed on
Jul 22, 1987
Sold by
Huckaby Leona Clines Richerson
Bought by
Johnson James Kenneth
Purchase Details
Closed on
Jan 1, 1975
Sold by
Cline
Bought by
Huckaby Leona Clines Richerson
Purchase Details
Closed on
Jan 10, 1957
Sold by
Huckaby Leona Richerson and Hucka George A
Bought by
Cline
Purchase Details
Closed on
Jan 1, 1957
Sold by
Richerson Mrs Leona Clines
Bought by
Huckaby Leona Richerson and Huckaby George A
Purchase Details
Closed on
Jan 1, 1951
Bought by
Richerson Mrs Leona Clines
Create a Home Valuation Report for This Property
The Home Valuation Report is an in-depth analysis detailing your home's value as well as a comparison with similar homes in the area
Home Values in the Area
Average Home Value in this Area
Purchase History
| Date | Buyer | Sale Price | Title Company |
|---|---|---|---|
| Pruitt William | $33,000 | -- | |
| P | -- | -- | |
| Radke Ronald E | $18,000 | -- | |
| Johnson Betty | -- | -- | |
| Johnson James Kenneth | $2,500 | -- | |
| Huckaby Leona Clines Richerson | -- | -- | |
| Cline | -- | -- | |
| Huckaby Leona Richerson | -- | -- | |
| Richerson Mrs Leona Clines | -- | -- |
Source: Public Records
Tax History Compared to Growth
Tax History
| Year | Tax Paid | Tax Assessment Tax Assessment Total Assessment is a certain percentage of the fair market value that is determined by local assessors to be the total taxable value of land and additions on the property. | Land | Improvement |
|---|---|---|---|---|
| 2024 | $483 | $25,388 | $16,764 | $8,624 |
| 2023 | $466 | $23,660 | $15,240 | $8,420 |
| 2022 | $370 | $17,676 | $12,090 | $5,586 |
| 2021 | $330 | $15,162 | $10,997 | $4,165 |
| 2020 | $302 | $13,517 | $9,562 | $3,955 |
| 2019 | $295 | $13,307 | $9,562 | $3,745 |
| 2018 | $286 | $12,707 | $9,108 | $3,599 |
| 2017 | $263 | $11,909 | $8,433 | $3,476 |
| 2016 | $263 | $11,801 | $8,400 | $3,401 |
| 2015 | $259 | $11,801 | $8,400 | $3,401 |
| 2014 | $259 | $11,801 | $8,400 | $3,401 |
Source: Public Records
Map
Nearby Homes
- 47 Boyd Rd SW
- 0 Old Blacks Bluff Rd SW Unit 10652523
- 3686 Blacks Bluff Rd SW
- 0 McGee Bend Rd SW Unit 10351960
- 0 Ausburn Rd SW Unit 10611100
- 3428 Horseleg Creek Rd SW
- 3241 Horseleg Creek Rd SW
- 0 Blacks Bluff Rd SW Unit 17015073
- 0 Oakmont Dr SW Unit 10648261
- 3 SW Highlander Trail SW
- 63 Highlander Trail SW
- 5165 Cave Spring Rd SW
- 458 Kraftsman Rd SW
- 14 Bryan Springs Rd SW
- 4365 Cave Spring Rd SW
- 0 Barker Rd SW Unit 10651788
- 0 Barker Rd SW Unit LotWP001
- 48 Highlander Trail SW
- 262 Blacks Bluff Rd SW
- 2081 Blacks Bluff Rd SW Unit LOT A
- 4144 Blacks Bluff Rd SW
- 4134 Blacks Bluff Rd SW
- 4160 Blacks Bluff Rd SW
- 4147 Blacks Bluff Rd SW
- 4114 Blacks Bluff Rd SW
- 4172 Blacks Bluff Rd SW
- 4169 Blacks Bluff Rd SW
- 4120 Blacks Bluff Rd SW
- 4120 Blacks Bluff Rd SW
- 4102 Blacks Bluff Rd SW
- 4109 Blacks Bluff Rd SW
- 4163 Blacks Bluff Rd SW
- 4234 Blacks Bluff Rd SW
- 4234 Blacks Bluff Rd SW
- 4084 Blacks Bluff Rd SW
- 4238 Blacks Bluff Rd SW
- 4085 Blacks Bluff Rd SW
- 4242 Blacks Bluff Rd SW
- 4267 Old Blacks Bluff Rd SW
- 4267 Old Blacks Bluff Rd SW