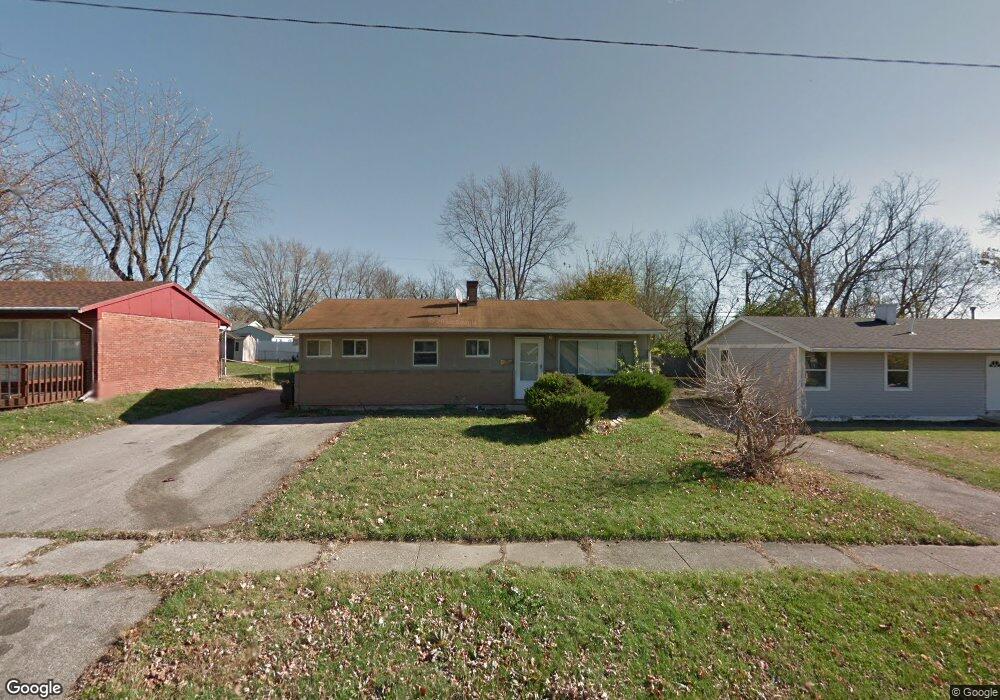
4146 Lobata Place Dayton, OH 45416
Fort McKinley NeighborhoodEstimated Value: $82,000 - $125,000
3
Beds
1
Bath
1,140
Sq Ft
$87/Sq Ft
Est. Value
About This Home
This home is located at 4146 Lobata Place, Dayton, OH 45416 and is currently estimated at $99,458, approximately $87 per square foot. 4146 Lobata Place is a home located in Montgomery County with nearby schools including Valerie Elementary School, Imagine Klepinger Road Community School, and North Dayton School of Science & Discovery.
Ownership History
Date
Name
Owned For
Owner Type
Purchase Details
Closed on
Oct 15, 2024
Sold by
Nrea Vb Iii Llc
Bought by
Vb Eleven Llc
Current Estimated Value
Purchase Details
Closed on
Nov 1, 2018
Sold by
Vbannex B Borrower Llc
Bought by
Nrea Vb Iii Llc
Purchase Details
Closed on
Jun 22, 2017
Sold by
Aramc Llc
Bought by
Vbannex B Borrower Llc
Purchase Details
Closed on
Oct 6, 2006
Sold by
Household Realty Corp
Bought by
Aramc Llc
Purchase Details
Closed on
Jun 16, 2006
Sold by
Daniels Gary V
Bought by
Household Realty Corp
Purchase Details
Closed on
Apr 5, 2000
Sold by
Williams Susan C and Winn Susan C
Bought by
Daniels Gary
Home Financials for this Owner
Home Financials are based on the most recent Mortgage that was taken out on this home.
Original Mortgage
$52,800
Interest Rate
10.8%
Purchase Details
Closed on
Apr 30, 1998
Sold by
Met Elnora
Bought by
Williams Susan C
Create a Home Valuation Report for This Property
The Home Valuation Report is an in-depth analysis detailing your home's value as well as a comparison with similar homes in the area
Home Values in the Area
Average Home Value in this Area
Purchase History
| Date | Buyer | Sale Price | Title Company |
|---|---|---|---|
| Vb Eleven Llc | $7,678,000 | None Listed On Document | |
| Nrea Vb Iii Llc | -- | Os National Llc | |
| Vbannex B Borrower Llc | $40,000 | None Available | |
| Aramc Llc | $30,000 | None Available | |
| Household Realty Corp | $38,000 | None Available | |
| Daniels Gary | $53,600 | -- | |
| Williams Susan C | $42,000 | -- | |
| Williams Susan C | $42,000 | -- |
Source: Public Records
Mortgage History
| Date | Status | Borrower | Loan Amount |
|---|---|---|---|
| Previous Owner | Daniels Gary | $52,800 |
Source: Public Records
Tax History Compared to Growth
Tax History
| Year | Tax Paid | Tax Assessment Tax Assessment Total Assessment is a certain percentage of the fair market value that is determined by local assessors to be the total taxable value of land and additions on the property. | Land | Improvement |
|---|---|---|---|---|
| 2024 | $1,453 | $18,980 | $7,670 | $11,310 |
| 2023 | $1,453 | $18,980 | $7,670 | $11,310 |
| 2022 | $1,359 | $13,000 | $5,250 | $7,750 |
| 2021 | $1,319 | $13,000 | $5,250 | $7,750 |
| 2020 | $1,350 | $13,000 | $5,250 | $7,750 |
| 2019 | $1,336 | $11,620 | $5,250 | $6,370 |
| 2018 | $1,407 | $11,620 | $5,250 | $6,370 |
| 2017 | $1,330 | $11,620 | $5,250 | $6,370 |
| 2016 | $1,443 | $12,190 | $5,250 | $6,940 |
| 2015 | $1,266 | $12,190 | $5,250 | $6,940 |
| 2014 | $1,266 | $12,190 | $5,250 | $6,940 |
| 2012 | -- | $14,670 | $7,700 | $6,970 |
Source: Public Records
Map
Nearby Homes
- 4321 Saylor St
- 3732 Beckley Ave
- 4130 Fleetwood Dr
- 4174 Meadowdale Dr
- 3539 Detroit Ave
- 3501 Piedmont Ave
- 4228 Molane St
- 0 Haney Rd E Unit 937713
- 4431 Wolf Rd
- 3633 El Paso Ave
- 4624 Fayette Ct
- 3114 Marlay Rd
- 3713 El Paso Ave
- 3130 Garvin Rd Unit 12
- 3122 Garvin Rd Unit 8
- 4535 Lansmore Dr Unit 97
- 3678 Wilmore St
- 4601 Merrick Dr Unit 79
- 4743 Shaunee Creek Dr Unit 21
- 4763 Shaunee Creek Dr Unit 31
- 4136 Lobata Place
- 4160 Lobata Place
- 4120 Lobata Place
- 4170 Lobata Place
- 4141 Mapleleaf Dr
- 4151 Mapleleaf Dr
- 4131 Mapleleaf Dr
- 4161 Mapleleaf Dr
- 4121 Mapleleaf Dr
- 4110 Lobata Place
- 4180 Lobata Place
- 4153 Lobata Place
- 4141 Lobata Place
- 4165 Lobata Place
- 4129 Lobata Place
- 4171 Mapleleaf Dr
- 4111 Mapleleaf Dr
- 4177 Lobata Place
- 4100 Lobata Place
- 4194 Lobata Place