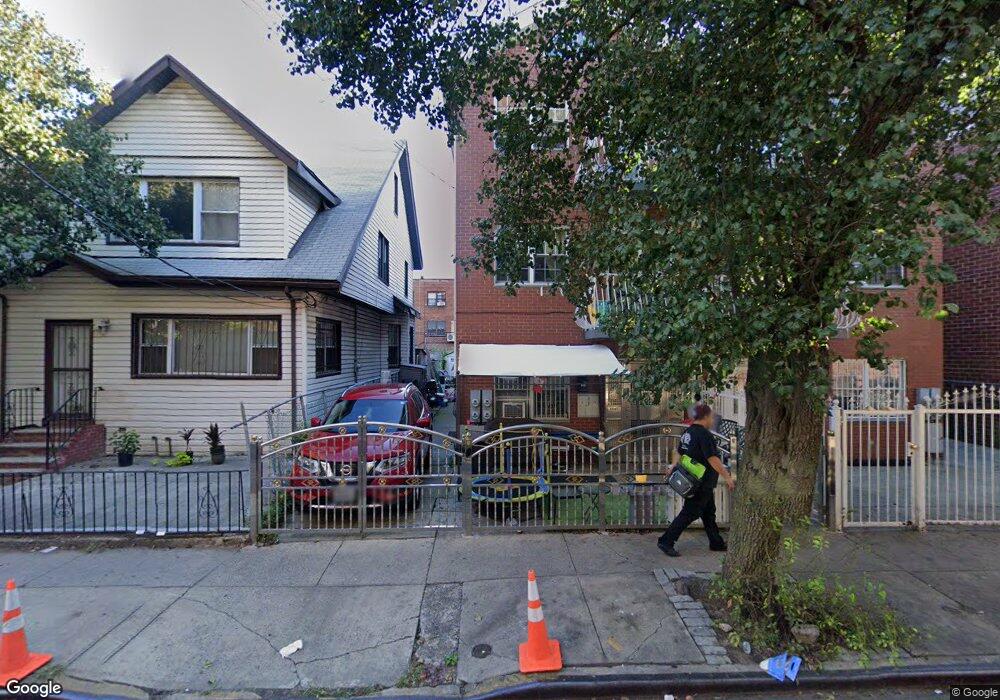
4147 Denman St Elmhurst, NY 11373
Elmhurst NeighborhoodEstimated Value: $1,631,000 - $1,772,000
--
Bed
--
Bath
3,060
Sq Ft
$554/Sq Ft
Est. Value
About This Home
This home is located at 4147 Denman St, Elmhurst, NY 11373 and is currently estimated at $1,694,756, approximately $553 per square foot. 4147 Denman St is a home located in Queens County with nearby schools including P.S. 19 Marino Jeantet, Is 61 Leonardo Da Vinci, and Newtown High School.
Ownership History
Date
Name
Owned For
Owner Type
Purchase Details
Closed on
Jun 13, 2008
Sold by
Lam Sau Lan and Lam Shun Por
Bought by
Lam Shun Por
Current Estimated Value
Purchase Details
Closed on
Sep 26, 2007
Sold by
Chen Yi Zhi and Chin Willam
Bought by
Lam Sau Lan and Lam Saun Por
Home Financials for this Owner
Home Financials are based on the most recent Mortgage that was taken out on this home.
Original Mortgage
$960,000
Outstanding Balance
$602,521
Interest Rate
6.49%
Mortgage Type
Purchase Money Mortgage
Estimated Equity
$1,092,235
Purchase Details
Closed on
Nov 9, 2005
Sold by
Galindo & Ferreira Corp
Bought by
Chen Yi Zhi and Chin William
Home Financials for this Owner
Home Financials are based on the most recent Mortgage that was taken out on this home.
Original Mortgage
$684,600
Interest Rate
6.06%
Mortgage Type
Purchase Money Mortgage
Create a Home Valuation Report for This Property
The Home Valuation Report is an in-depth analysis detailing your home's value as well as a comparison with similar homes in the area
Home Values in the Area
Average Home Value in this Area
Purchase History
| Date | Buyer | Sale Price | Title Company |
|---|---|---|---|
| Lam Shun Por | -- | -- | |
| Lam Shun Por | -- | -- | |
| Lam Sau Lan | $1,080,000 | -- | |
| Lam Sau Lan | $1,080,000 | -- | |
| Chen Yi Zhi | $978,000 | -- | |
| Chen Yi Zhi | $978,000 | -- |
Source: Public Records
Mortgage History
| Date | Status | Borrower | Loan Amount |
|---|---|---|---|
| Open | Lam Sau Lan | $960,000 | |
| Closed | Lam Sau Lan | $960,000 | |
| Previous Owner | Chen Yi Zhi | $684,600 |
Source: Public Records
Tax History Compared to Growth
Tax History
| Year | Tax Paid | Tax Assessment Tax Assessment Total Assessment is a certain percentage of the fair market value that is determined by local assessors to be the total taxable value of land and additions on the property. | Land | Improvement |
|---|---|---|---|---|
| 2025 | $2,624 | $102,960 | $15,488 | $87,472 |
| 2024 | $2,624 | $99,480 | $15,601 | $83,879 |
| 2023 | $2,624 | $97,620 | $15,835 | $81,785 |
| 2022 | $1,956 | $89,880 | $26,460 | $63,420 |
| 2021 | $2,749 | $92,820 | $26,460 | $66,360 |
| 2020 | $2,765 | $102,000 | $26,460 | $75,540 |
| 2019 | $2,733 | $88,680 | $26,460 | $62,220 |
| 2018 | $2,663 | $48,684 | $18,983 | $29,701 |
| 2017 | $2,663 | $47,022 | $18,384 | $28,638 |
| 2016 | $2,611 | $47,022 | $18,384 | $28,638 |
| 2015 | $1,784 | $41,851 | $21,933 | $19,918 |
| 2014 | $1,784 | $40,732 | $25,621 | $15,111 |
Source: Public Records
Map
Nearby Homes
- 41-41 Denman St
- 9318 Lamont Ave
- 4239 Elbertson St
- 92-29 Lamont Ave Unit 2K
- 92-29 Lamont Ave Unit 2
- 93-09 43rd Ave
- 9205 Whitney Ave Unit A42
- 40-70 Case St
- 4131 95th St
- 40-26 Benham St
- 9461 43rd Ave
- 95-13 42nd Ave
- 40-66 Denman St
- 91-16 43rd Ave
- 4040 Case St
- 42-87 Hampton St
- 95-20 41st Ave
- 91-08 43rd Ave
- 41-20 Elbertson St
- 91-23 Corona Ave Unit 6B
- 4143 Denman St
- 4149 Denman St
- 4141 Denman St
- 4155 Denman St
- 93-09 Lamont Ave Unit 4A
- 93-09 Lamont Ave Unit 6C
- 93-09 Lamont Ave Unit 5C
- 93-09 Lamont Ave Unit 3C
- 4139 Denman St
- 9307 Lamont Ave
- 4157 Denman St
- 9309 Lamont Ave
- 9311 Lamont Ave
- 4148 Case St
- 4146 Case St
- 4150 Case St
- 4144 Case St
- 41-46 Denman St
- 9313 Lamont Ave
- 93-13 Lamont Ave Unit 4