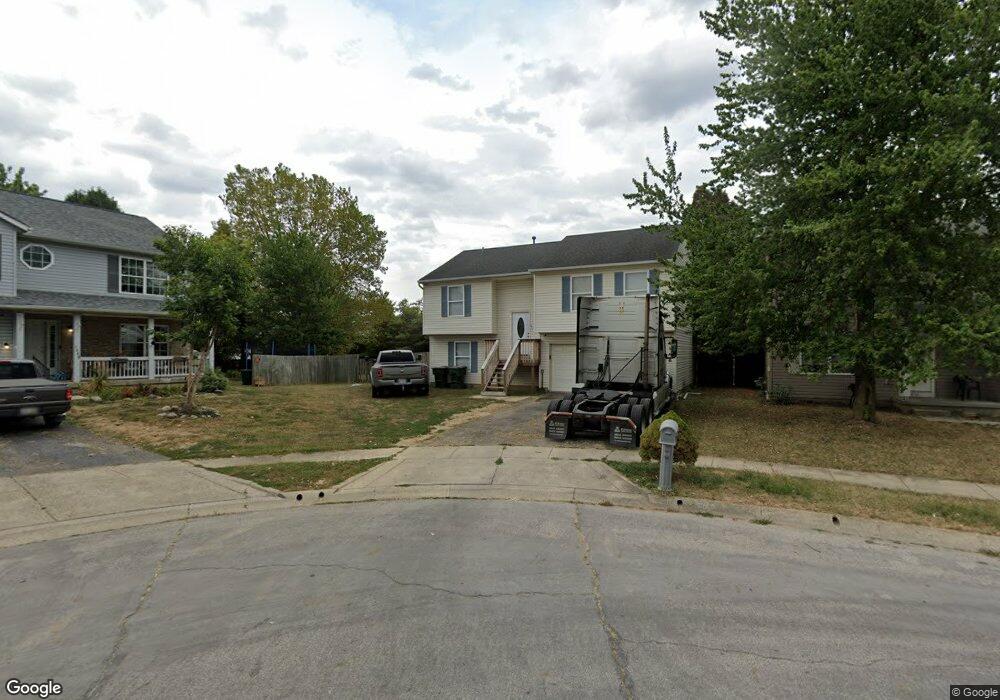
4148 Nipigon Dr Columbus, OH 43207
Obetz-Lockbourne NeighborhoodEstimated Value: $284,000 - $313,000
3
Beds
3
Baths
1,642
Sq Ft
$180/Sq Ft
Est. Value
About This Home
This home is located at 4148 Nipigon Dr, Columbus, OH 43207 and is currently estimated at $295,892, approximately $180 per square foot. 4148 Nipigon Dr is a home located in Franklin County with nearby schools including Hamilton Elementary School, Hamilton Intermediate School, and Hamilton Middle School.
Ownership History
Date
Name
Owned For
Owner Type
Purchase Details
Closed on
Jul 14, 2009
Sold by
Ezell Jospeh and Kostas Jason
Bought by
Ingold Adam T
Current Estimated Value
Home Financials for this Owner
Home Financials are based on the most recent Mortgage that was taken out on this home.
Original Mortgage
$111,823
Outstanding Balance
$73,427
Interest Rate
5.43%
Mortgage Type
FHA
Estimated Equity
$222,465
Purchase Details
Closed on
Feb 15, 2007
Sold by
Hud
Bought by
Ezell Joseph and Kostas Jason
Home Financials for this Owner
Home Financials are based on the most recent Mortgage that was taken out on this home.
Original Mortgage
$102,500
Interest Rate
6.23%
Mortgage Type
Purchase Money Mortgage
Purchase Details
Closed on
Oct 5, 2006
Sold by
Haddox Steven E and Nationwide Advantage Mortgage
Bought by
Hud
Purchase Details
Closed on
Apr 1, 2002
Sold by
Crossmann Communities Of Ohio Inc
Bought by
Haddox Steven E
Home Financials for this Owner
Home Financials are based on the most recent Mortgage that was taken out on this home.
Original Mortgage
$130,833
Interest Rate
6.82%
Mortgage Type
FHA
Create a Home Valuation Report for This Property
The Home Valuation Report is an in-depth analysis detailing your home's value as well as a comparison with similar homes in the area
Home Values in the Area
Average Home Value in this Area
Purchase History
| Date | Buyer | Sale Price | Title Company |
|---|---|---|---|
| Ingold Adam T | $113,900 | Real Living | |
| Ezell Joseph | $102,500 | Lakeside Title & Escrow Agen | |
| Hud | $84,000 | None Available | |
| Haddox Steven E | $131,900 | Chicago Title West |
Source: Public Records
Mortgage History
| Date | Status | Borrower | Loan Amount |
|---|---|---|---|
| Open | Ingold Adam T | $111,823 | |
| Previous Owner | Ezell Joseph | $102,500 | |
| Previous Owner | Haddox Steven E | $130,833 |
Source: Public Records
Tax History Compared to Growth
Tax History
| Year | Tax Paid | Tax Assessment Tax Assessment Total Assessment is a certain percentage of the fair market value that is determined by local assessors to be the total taxable value of land and additions on the property. | Land | Improvement |
|---|---|---|---|---|
| 2024 | $3,499 | $90,760 | $25,200 | $65,560 |
| 2023 | $3,442 | $90,760 | $25,200 | $65,560 |
| 2022 | $1,994 | $47,780 | $9,660 | $38,120 |
| 2021 | $2,027 | $47,780 | $9,660 | $38,120 |
| 2020 | $2,074 | $47,780 | $9,660 | $38,120 |
| 2019 | $1,893 | $39,800 | $8,050 | $31,750 |
| 2018 | $1,861 | $39,800 | $8,050 | $31,750 |
| 2017 | $1,866 | $39,800 | $8,050 | $31,750 |
| 2016 | $1,817 | $35,320 | $8,370 | $26,950 |
| 2015 | $1,840 | $35,320 | $8,370 | $26,950 |
| 2014 | $1,847 | $35,320 | $8,370 | $26,950 |
| 2013 | $947 | $37,170 | $8,820 | $28,350 |
Source: Public Records
Map
Nearby Homes
- 1187 Rendezvous Ln
- 4451 1/2 Lockbourne Rd Unit R
- 1101 Meadow Ln
- 1097 Rendezvous Ln
- 1091 Vernon Dr
- 1566 Chillicothe St
- 1341 Halfhill Way
- 965 Radbourne Dr
- 4207 Crosspointe Dr
- 1632 Marlboro Ave
- 989 Lavender Ln
- 1583 Metcalfe Ave
- 1649 Obetz Ave
- 1597 Metcalfe Ave
- 1068 Tobi Dr
- 1456 Magoffin Ave
- 864 Robmeyer Dr
- 3991 Graves Dr
- 1118 Maplewood Rd
- 904 Kyle Ave
- 1368 Kariba Dr
- 4156 Nipigon Dr
- 4164 Nipigon Dr
- 1360 Kariba Dr
- 4172 Nipigon Dr
- 1352 Kariba Dr
- 4165 Nipigon Dr
- 4180 Nipigon Dr
- 4173 Nipigon Dr
- 1344 Kariba Dr
- 4188 Nipigon Dr
- 4181 Nipigon Dr
- 1336 Kariba Dr
- 4196 Nipigon Dr
- 4189 Nipigon Dr
- 4148 Umiak Dr
- 4158 Umiak Dr
- 4197 Nipigon Dr
- 4204 Nipigon Dr
- 1328 Kariba Dr