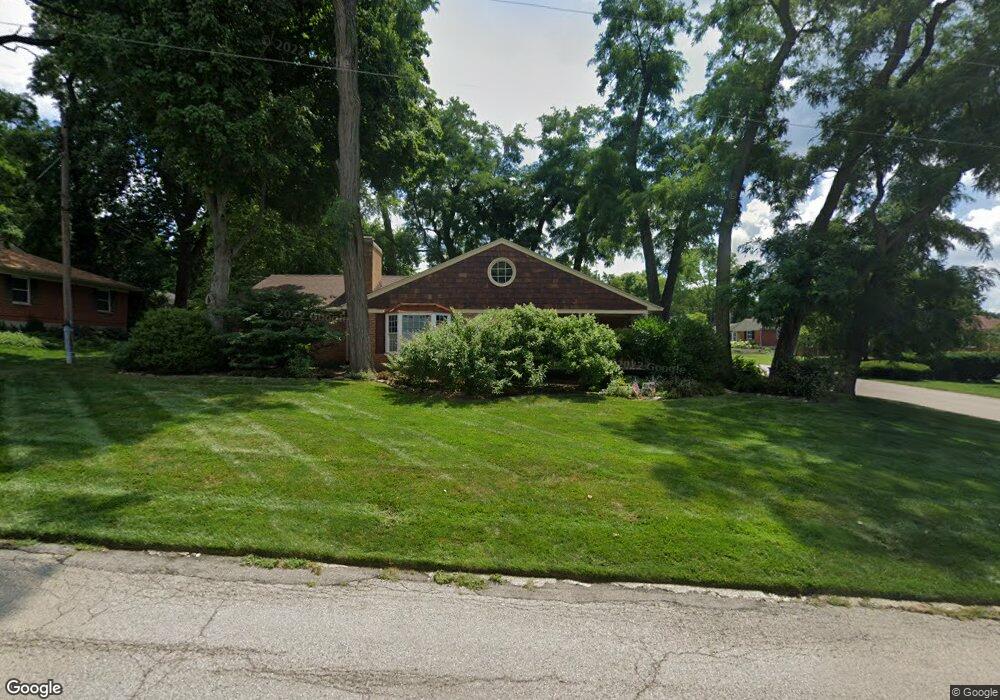
4148 Stonehaven Rd Dayton, OH 45429
Estimated Value: $285,000 - $344,000
3
Beds
2
Baths
1,639
Sq Ft
$191/Sq Ft
Est. Value
About This Home
This home is located at 4148 Stonehaven Rd, Dayton, OH 45429 and is currently estimated at $313,546, approximately $191 per square foot. 4148 Stonehaven Rd is a home located in Montgomery County with nearby schools including Southdale Elementary School, Van Buren Middle School, and Kettering Fairmont High School.
Ownership History
Date
Name
Owned For
Owner Type
Purchase Details
Closed on
Aug 16, 2013
Sold by
Greenwood Barton L and Greenwood Mary E
Bought by
Wyke Steven J and Wyke Patty S
Current Estimated Value
Home Financials for this Owner
Home Financials are based on the most recent Mortgage that was taken out on this home.
Original Mortgage
$159,000
Interest Rate
4.53%
Mortgage Type
VA
Purchase Details
Closed on
Jul 9, 2011
Sold by
Pope Doris K and Young Fred
Bought by
Greenwood Mary E and Greenwood Barton L
Home Financials for this Owner
Home Financials are based on the most recent Mortgage that was taken out on this home.
Original Mortgage
$123,200
Interest Rate
4.56%
Mortgage Type
Purchase Money Mortgage
Purchase Details
Closed on
Dec 4, 1998
Sold by
Negrelli Thomas J and Negrelli Audrey L
Bought by
Pope Doris E
Create a Home Valuation Report for This Property
The Home Valuation Report is an in-depth analysis detailing your home's value as well as a comparison with similar homes in the area
Home Values in the Area
Average Home Value in this Area
Purchase History
| Date | Buyer | Sale Price | Title Company |
|---|---|---|---|
| Wyke Steven J | $159,000 | None Available | |
| Greenwood Mary E | $154,000 | Attorney | |
| Pope Doris E | $136,500 | -- | |
| Pope Doris K | $136,500 | -- |
Source: Public Records
Mortgage History
| Date | Status | Borrower | Loan Amount |
|---|---|---|---|
| Previous Owner | Wyke Steven J | $159,000 | |
| Previous Owner | Greenwood Mary E | $123,200 |
Source: Public Records
Tax History Compared to Growth
Tax History
| Year | Tax Paid | Tax Assessment Tax Assessment Total Assessment is a certain percentage of the fair market value that is determined by local assessors to be the total taxable value of land and additions on the property. | Land | Improvement |
|---|---|---|---|---|
| 2024 | $4,204 | $76,960 | $22,600 | $54,360 |
| 2023 | $4,204 | $76,960 | $22,600 | $54,360 |
| 2022 | $3,825 | $57,520 | $16,860 | $40,660 |
| 2021 | $3,538 | $57,520 | $16,860 | $40,660 |
| 2020 | $3,550 | $57,520 | $16,860 | $40,660 |
| 2019 | $3,056 | $45,850 | $16,060 | $29,790 |
| 2018 | $3,072 | $45,850 | $16,060 | $29,790 |
| 2017 | $2,830 | $45,850 | $16,060 | $29,790 |
| 2016 | $3,063 | $46,500 | $16,060 | $30,440 |
| 2015 | $2,926 | $46,500 | $16,060 | $30,440 |
| 2014 | $2,926 | $46,500 | $16,060 | $30,440 |
| 2012 | -- | $46,770 | $15,980 | $30,790 |
Source: Public Records
Map
Nearby Homes
- 298 Marchester Dr
- 209 Westhaven Dr
- 425 Ivycrest Terrace
- 3993 Applewood Ln
- 516 Pauley Woods Cir
- 563 Eagle Cir
- 115 N Bromfield Rd
- 229 S Bromfield Rd
- 309 Henrich Dr
- 508 Schuyler Dr
- 4259 Maxlin Rd
- 849 Danan Cir
- 548 Winding Way
- 4400 Royal Ridge Way
- 3212 Lenox Dr
- 776 Lovetta Dr
- 101 Blue Gate Cir Unit 1
- 4816 Judith Dr
- 4824 Far Hills Ave
- 5095 Wheaton St
- 273 Napoleon Dr
- 4100 Stonehaven Rd
- 280 Napoleon Dr
- 280 Napoleon Dr Unit Dayton
- 272 Sherbrooke Dr
- 272 Napoleon Dr
- 4149 Stonehaven Rd
- 265 Napoleon Dr
- 4133 Stonehaven Rd
- 4165 Stonehaven Rd
- 264 Napoleon Dr
- 4117 Stonehaven Rd
- 264 Sherbrooke Dr
- 281 Sherbrooke Dr
- 4201 Stonehaven Rd
- 265 Castle Dr
- 257 Castle Dr
- 257 Napoleon Dr
- 4087 Stonehaven Rd
- 248 Napoleon Dr