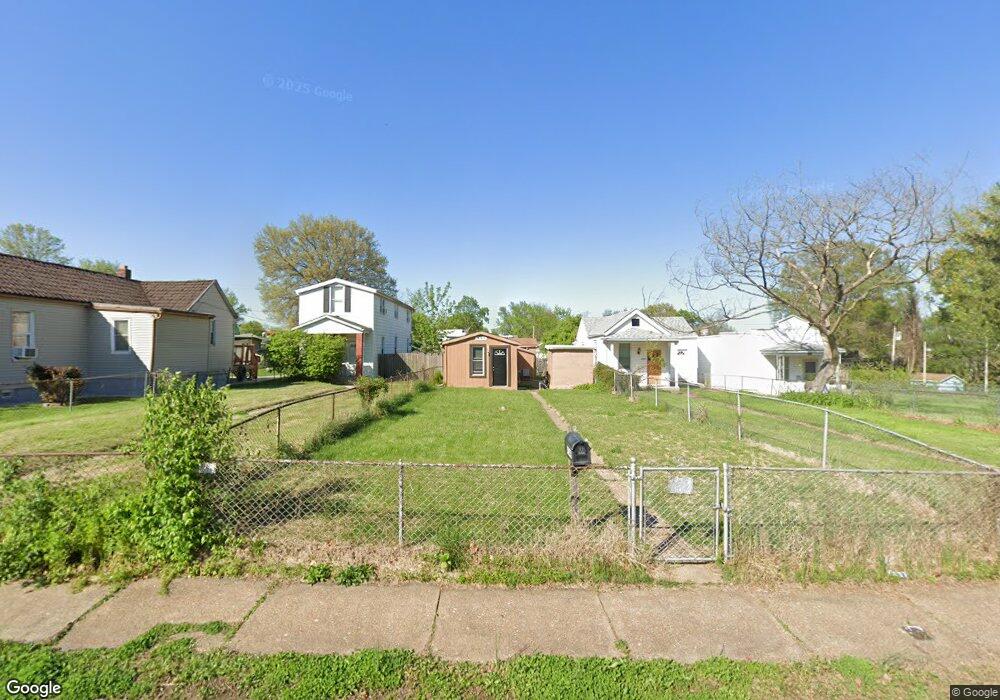
4149 Eichelberger St Saint Louis, MO 63116
Bevo Mill NeighborhoodEstimated Value: $72,000 - $133,000
--
Bed
1
Bath
1,812
Sq Ft
$61/Sq Ft
Est. Value
About This Home
This home is located at 4149 Eichelberger St, Saint Louis, MO 63116 and is currently estimated at $111,367, approximately $61 per square foot. 4149 Eichelberger St is a home located in St. Louis City with nearby schools including Woerner Elementary School, Long International Middle School, and Roosevelt High School.
Ownership History
Date
Name
Owned For
Owner Type
Purchase Details
Closed on
Feb 28, 2018
Sold by
Rei Options Llc Series 7
Bought by
De Properties Llc
Current Estimated Value
Home Financials for this Owner
Home Financials are based on the most recent Mortgage that was taken out on this home.
Original Mortgage
$55,000
Outstanding Balance
$46,745
Interest Rate
4.04%
Mortgage Type
Future Advance Clause Open End Mortgage
Estimated Equity
$64,622
Purchase Details
Closed on
Nov 17, 2017
Sold by
4149 Eichelberger Llc
Bought by
Rei Options Llc Series 7
Purchase Details
Closed on
Aug 15, 2003
Sold by
Stiers Dewayne and Stiers Terry Cline
Bought by
4149 Eichelberger Llc
Purchase Details
Closed on
Nov 5, 1999
Sold by
Thole Steven D
Bought by
Stiers Dewayne L and Cline Terry Lee
Purchase Details
Closed on
Apr 13, 1998
Sold by
Carol Thole
Bought by
Thole Steven D
Create a Home Valuation Report for This Property
The Home Valuation Report is an in-depth analysis detailing your home's value as well as a comparison with similar homes in the area
Home Values in the Area
Average Home Value in this Area
Purchase History
| Date | Buyer | Sale Price | Title Company |
|---|---|---|---|
| De Properties Llc | $30,000 | Continental Title | |
| Rei Options Llc Series 7 | -- | None Available | |
| 4149 Eichelberger Llc | -- | -- | |
| Stiers Dewayne L | -- | -- | |
| Thole Steven D | -- | -- |
Source: Public Records
Mortgage History
| Date | Status | Borrower | Loan Amount |
|---|---|---|---|
| Open | De Properties Llc | $55,000 |
Source: Public Records
Tax History Compared to Growth
Tax History
| Year | Tax Paid | Tax Assessment Tax Assessment Total Assessment is a certain percentage of the fair market value that is determined by local assessors to be the total taxable value of land and additions on the property. | Land | Improvement |
|---|---|---|---|---|
| 2025 | $371 | $4,650 | $910 | $3,740 |
| 2024 | $354 | $4,100 | $910 | $3,190 |
| 2023 | $354 | $4,100 | $910 | $3,190 |
| 2022 | $339 | $3,760 | $910 | $2,850 |
| 2021 | $338 | $3,760 | $910 | $2,850 |
| 2020 | $311 | $3,460 | $910 | $2,550 |
| 2019 | $310 | $3,460 | $910 | $2,550 |
| 2018 | $297 | $3,190 | $910 | $2,280 |
| 2017 | $292 | $3,190 | $910 | $2,280 |
| 2016 | $295 | $3,190 | $910 | $2,280 |
| 2015 | $270 | $3,190 | $910 | $2,280 |
| 2014 | $265 | $3,190 | $910 | $2,280 |
| 2013 | -- | $3,110 | $910 | $2,200 |
Source: Public Records
Map
Nearby Homes
- 4171 Eichelberger St
- 4163 Walsh St
- 4045 Walsh St
- 4028 Schiller Place
- 4177 Walsh St
- 4010 Schiller Place
- 4201 Walsh St
- 5019 Alexander St
- 4321 Bates St
- 5632 Leona St
- 4009 Burgen Ave
- 4729 Adkins Ave
- 3904 Walsh St
- 3915 Schiller Place
- 3910 Schiller Place
- 3934 Randall St
- 4642 Steffens Ave
- 5907 Leona St
- 4639 Adkins Ave
- 5348 Gilson Ave
- 4153 Eichelberger St
- 4147 Eichelberger St
- 4155 Eichelberger St
- 4143 Eichelberger St
- 4157 Eichelberger St
- 4159 Eichelberger St
- 4141 Eichelberger St
- 4165 Eichelberger St
- 4142 Walsh St
- 4137 Eichelberger St
- 4167 Eichelberger St
- 4143 Schiller Place
- 4147 Schiller Place
- 4137 Schiller Place
- 4149 Schiller Place
- 4135 Eichelberger St
- 4131 Eichelberger St
- 4135 Schiller Place
- 4148 Walsh St
- 4146 Walsh St