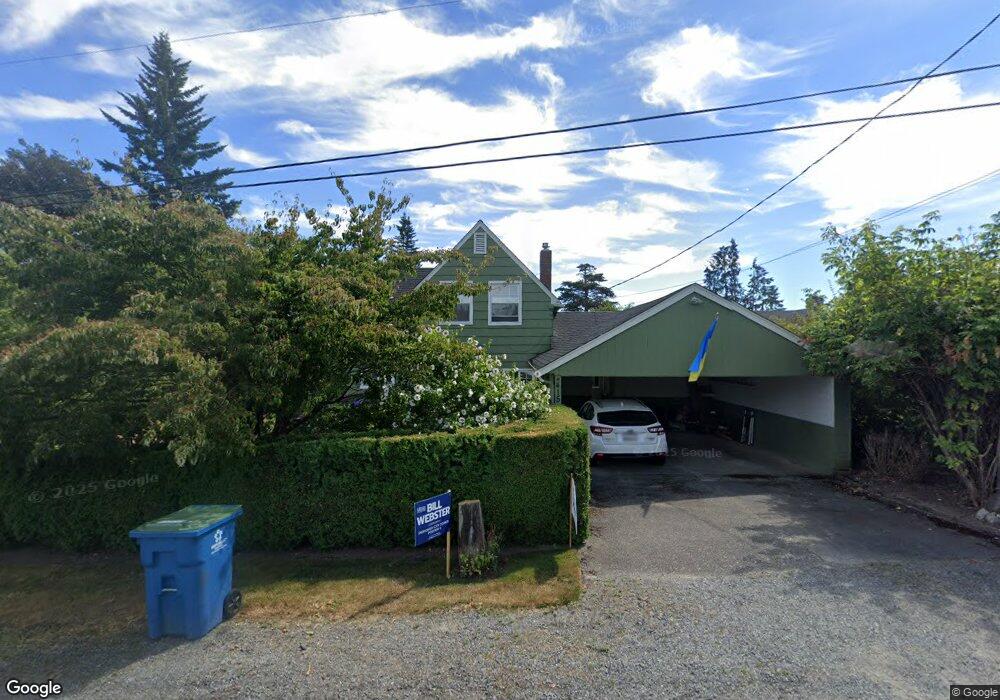
415 9th St Snohomish, WA 98290
Estimated Value: $768,000 - $833,309
4
Beds
2
Baths
2,112
Sq Ft
$374/Sq Ft
Est. Value
About This Home
This home is located at 415 9th St, Snohomish, WA 98290 and is currently estimated at $790,577, approximately $374 per square foot. 415 9th St is a home located in Snohomish County with nearby schools including Central Emerson Elementary School, Centennial Middle School, and Snohomish High School.
Ownership History
Date
Name
Owned For
Owner Type
Purchase Details
Closed on
Dec 22, 2006
Sold by
Wolfe Patricia
Bought by
Miller Mark J and Drake Garner Julie
Current Estimated Value
Home Financials for this Owner
Home Financials are based on the most recent Mortgage that was taken out on this home.
Original Mortgage
$318,360
Outstanding Balance
$189,390
Interest Rate
6.22%
Mortgage Type
Purchase Money Mortgage
Estimated Equity
$601,188
Purchase Details
Closed on
Aug 29, 2005
Sold by
Eastside Funding Llc
Bought by
Wolfe Patricia
Purchase Details
Closed on
Aug 24, 2005
Sold by
Francis Lynn D and Francis Cindy S
Bought by
Wolfe Patricia
Create a Home Valuation Report for This Property
The Home Valuation Report is an in-depth analysis detailing your home's value as well as a comparison with similar homes in the area
Home Values in the Area
Average Home Value in this Area
Purchase History
| Date | Buyer | Sale Price | Title Company |
|---|---|---|---|
| Miller Mark J | $397,950 | Chicago | |
| Wolfe Patricia | -- | -- | |
| Wolfe Patricia | $275,000 | -- |
Source: Public Records
Mortgage History
| Date | Status | Borrower | Loan Amount |
|---|---|---|---|
| Open | Miller Mark J | $318,360 |
Source: Public Records
Tax History Compared to Growth
Tax History
| Year | Tax Paid | Tax Assessment Tax Assessment Total Assessment is a certain percentage of the fair market value that is determined by local assessors to be the total taxable value of land and additions on the property. | Land | Improvement |
|---|---|---|---|---|
| 2025 | $6,068 | $672,500 | $430,000 | $242,500 |
| 2024 | $6,068 | $623,800 | $390,000 | $233,800 |
| 2023 | $6,133 | $699,000 | $420,000 | $279,000 |
| 2022 | $5,582 | $517,000 | $280,000 | $237,000 |
| 2020 | $5,146 | $443,000 | $235,000 | $208,000 |
| 2019 | $4,820 | $423,500 | $218,000 | $205,500 |
| 2018 | $5,112 | $376,100 | $192,000 | $184,100 |
| 2017 | $4,490 | $336,700 | $167,000 | $169,700 |
| 2016 | $4,402 | $320,000 | $156,000 | $164,000 |
| 2015 | $4,049 | $281,800 | $134,000 | $147,800 |
| 2013 | $3,317 | $224,100 | $89,000 | $135,100 |
Source: Public Records
Map
Nearby Homes