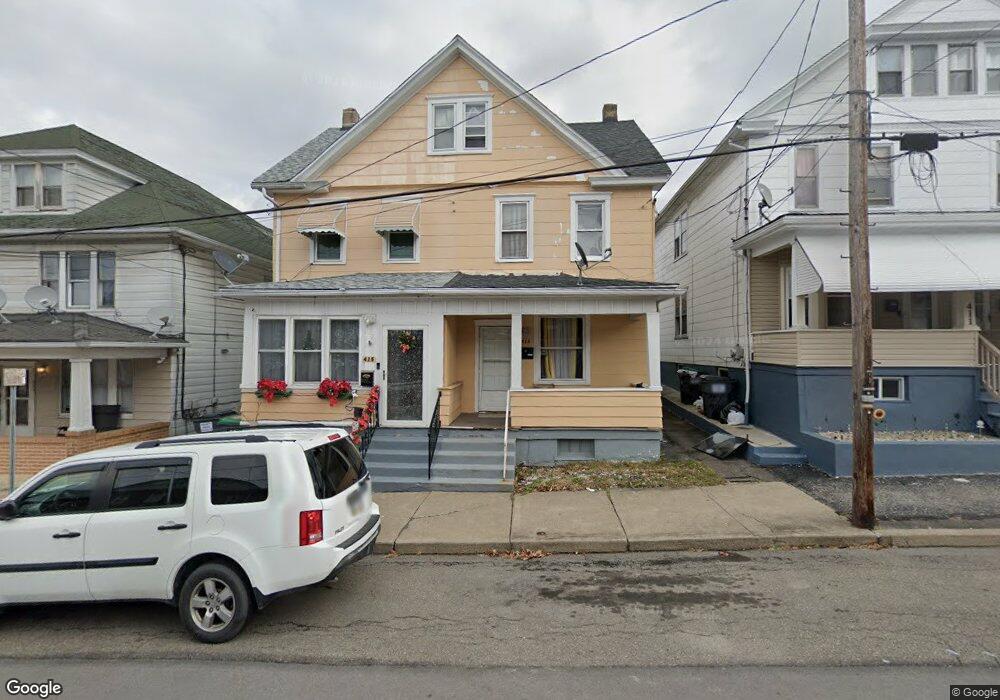
415 Allen St West Hazleton, PA 18202
Estimated Value: $87,466 - $149,000
--
Bed
--
Bath
994
Sq Ft
$125/Sq Ft
Est. Value
About This Home
This home is located at 415 Allen St, West Hazleton, PA 18202 and is currently estimated at $124,367, approximately $125 per square foot. 415 Allen St is a home located in Luzerne County with nearby schools including Hazleton Area High School, Immanuel Christian School, and Bishop Hafey Junior/Senior High School.
Ownership History
Date
Name
Owned For
Owner Type
Purchase Details
Closed on
Dec 29, 2021
Sold by
Northeastern Pennsylvania Investors Grou
Bought by
Diaz Glenys Gomez
Current Estimated Value
Purchase Details
Closed on
Jan 25, 2018
Sold by
Kulig John R
Bought by
Northeastern Pennsylvania Investors Group Inc
Purchase Details
Closed on
Sep 28, 2017
Sold by
County Of Luzerne
Bought by
Northeastern Pennsylvania Investors Grou
Purchase Details
Closed on
Oct 17, 1997
Bought by
Kulig Francis G
Create a Home Valuation Report for This Property
The Home Valuation Report is an in-depth analysis detailing your home's value as well as a comparison with similar homes in the area
Home Values in the Area
Average Home Value in this Area
Purchase History
| Date | Buyer | Sale Price | Title Company |
|---|---|---|---|
| Diaz Glenys Gomez | -- | None Listed On Document | |
| Northeastern Pennsylvania Investors Group Inc | -- | None Listed On Document | |
| Northeastern Pennsylvania Investors Grou | $6,322 | None Available | |
| Kulig Francis G | -- | -- |
Source: Public Records
Tax History Compared to Growth
Tax History
| Year | Tax Paid | Tax Assessment Tax Assessment Total Assessment is a certain percentage of the fair market value that is determined by local assessors to be the total taxable value of land and additions on the property. | Land | Improvement |
|---|---|---|---|---|
| 2025 | $1,206 | $47,800 | $19,700 | $28,100 |
| 2024 | $1,166 | $47,800 | $19,700 | $28,100 |
| 2023 | $1,136 | $47,800 | $19,700 | $28,100 |
| 2022 | $1,127 | $47,800 | $19,700 | $28,100 |
| 2021 | $1,099 | $47,800 | $19,700 | $28,100 |
| 2020 | $1,084 | $47,800 | $19,700 | $28,100 |
| 2019 | $1,000 | $47,800 | $19,700 | $28,100 |
| 2018 | $968 | $47,800 | $19,700 | $28,100 |
| 2017 | $951 | $47,800 | $19,700 | $28,100 |
| 2016 | -- | $47,800 | $19,700 | $28,100 |
| 2015 | $388 | $47,800 | $19,700 | $28,100 |
| 2014 | $388 | $47,800 | $19,700 | $28,100 |
Source: Public Records
Map
Nearby Homes
- 425 Anchor St
- 60 E Jefferson Ave
- 667 Roosevelt St
- 124 Putnam St
- 609 Landmesser Ave
- 9 Park St
- 590 Mckinley St
- 118 E Green St
- 31 Park St
- 307 W Green St
- 111 S Broad St
- 756 Peace St
- 328 W Green St
- 1 W Diamond Ave
- 329 Ridge Ave
- 782 N James St
- 536 W Green St
- 1009 Peace St
- 0 Pennsylvania 93
- 882 N Locust St