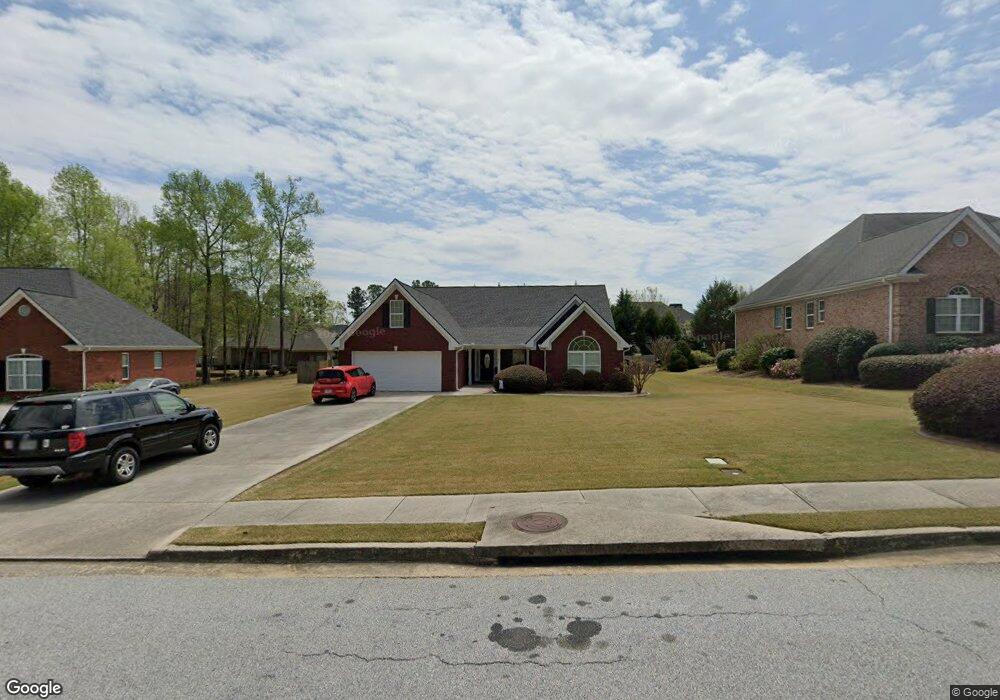
415 Chicamauga Ct Loganville, GA 30052
Estimated Value: $428,858 - $496,000
3
Beds
2
Baths
2,722
Sq Ft
$170/Sq Ft
Est. Value
About This Home
This home is located at 415 Chicamauga Ct, Loganville, GA 30052 and is currently estimated at $462,465, approximately $169 per square foot. 415 Chicamauga Ct is a home located in Walton County with nearby schools including Loganville Elementary School, Loganville Middle School, and Loganville High School.
Ownership History
Date
Name
Owned For
Owner Type
Purchase Details
Closed on
Apr 10, 2017
Sold by
Cavenaugh Gordon Douglas
Bought by
Cavenaugh Shirley Ann
Current Estimated Value
Purchase Details
Closed on
Dec 14, 2010
Sold by
Cavenaugh Shirley
Bought by
Cavenaugh Gordon
Purchase Details
Closed on
Apr 30, 2009
Sold by
Wells Fargo Bk 2006-Shl1
Bought by
Cavenaugh Shirley A
Home Financials for this Owner
Home Financials are based on the most recent Mortgage that was taken out on this home.
Original Mortgage
$143,920
Interest Rate
4.8%
Mortgage Type
New Conventional
Purchase Details
Closed on
Feb 3, 2009
Sold by
Myers Mark S
Bought by
Wells Fargo Bank Na 2006-Shl1
Purchase Details
Closed on
Aug 16, 2004
Sold by
Caleb Promised Land Builders Inc
Bought by
Myers Mark S
Home Financials for this Owner
Home Financials are based on the most recent Mortgage that was taken out on this home.
Original Mortgage
$207,900
Interest Rate
7%
Mortgage Type
New Conventional
Purchase Details
Closed on
Feb 3, 2004
Sold by
D Edward Young Construction Inc
Bought by
Caleb Promised Land Builders Inc
Create a Home Valuation Report for This Property
The Home Valuation Report is an in-depth analysis detailing your home's value as well as a comparison with similar homes in the area
Home Values in the Area
Average Home Value in this Area
Purchase History
| Date | Buyer | Sale Price | Title Company |
|---|---|---|---|
| Cavenaugh Shirley Ann | -- | -- | |
| Cavenaugh Gordon | -- | -- | |
| Cavenaugh Shirley A | $179,900 | -- | |
| Wells Fargo Bank Na 2006-Shl1 | $189,800 | -- | |
| Myers Mark S | $259,900 | -- | |
| Caleb Promised Land Builders Inc | $600,000 | -- |
Source: Public Records
Mortgage History
| Date | Status | Borrower | Loan Amount |
|---|---|---|---|
| Previous Owner | Cavenaugh Shirley A | $143,920 | |
| Previous Owner | Myers Mark S | $207,900 |
Source: Public Records
Tax History Compared to Growth
Tax History
| Year | Tax Paid | Tax Assessment Tax Assessment Total Assessment is a certain percentage of the fair market value that is determined by local assessors to be the total taxable value of land and additions on the property. | Land | Improvement |
|---|---|---|---|---|
| 2024 | $503 | $168,000 | $32,000 | $136,000 |
| 2023 | $397 | $149,320 | $29,600 | $119,720 |
| 2022 | $598,494 | $134,720 | $27,600 | $107,120 |
| 2021 | $4,839 | $108,920 | $16,000 | $92,920 |
| 2020 | $4,672 | $105,160 | $16,000 | $89,160 |
| 2019 | $4,254 | $95,760 | $16,000 | $79,760 |
| 2018 | $4,220 | $95,760 | $16,000 | $79,760 |
| 2017 | $3,462 | $78,560 | $16,000 | $62,560 |
| 2016 | $3,404 | $77,240 | $16,000 | $61,240 |
| 2015 | $21 | $77,240 | $16,000 | $61,240 |
| 2014 | $34 | $70,480 | $0 | $0 |
Source: Public Records
Map
Nearby Homes
- 403 Chicamauga Ct
- 408 Arbor Ln
- 508 Arbor Trail
- 139 Tara Blvd
- 314 Savannah Place
- 233 Tara Commons Walk
- 112 Tara Blvd
- 152 Tara Commons Dr
- 453 Tara Commons Cir
- 3467 Tom Brewer Rd
- 3487 Tom Brewer Rd
- 711 Wilhaven Ct
- 405 Mallory Cir
- 3657 Linda Dr
- 3241 Broadnax Mill Rd
- 330 Brittney Cove Unit 2
- 3520 Tom Brewer Rd
- 413 Chicamauga Ct
- 417 Chicamauga Ct
- 208 Missionary Ridge
- 210 Missionary Ridge
- 206 Missionary Ridge
- 304 Cold Harbor Dr
- 0 Chicamauga Ct Unit 7464493
- 0 Chicamauga Ct Unit 8896102
- 0 Chicamauga Ct Unit 8605077
- 0 Chicamauga Ct Unit 8002238
- 0 Chicamauga Ct Unit 7443714
- 0 Chicamauga Ct Unit 7509230
- 0 Chicamauga Ct Unit 7350695
- 302 Cold Harbor Dr
- 414 Chicamauga Ct
- 420 Chicamauga Ct
- 418 Chicamauga Ct
- 416 Chicamauga Ct
- 202 Missionary Ridge
- 412 Chicamauga Ct