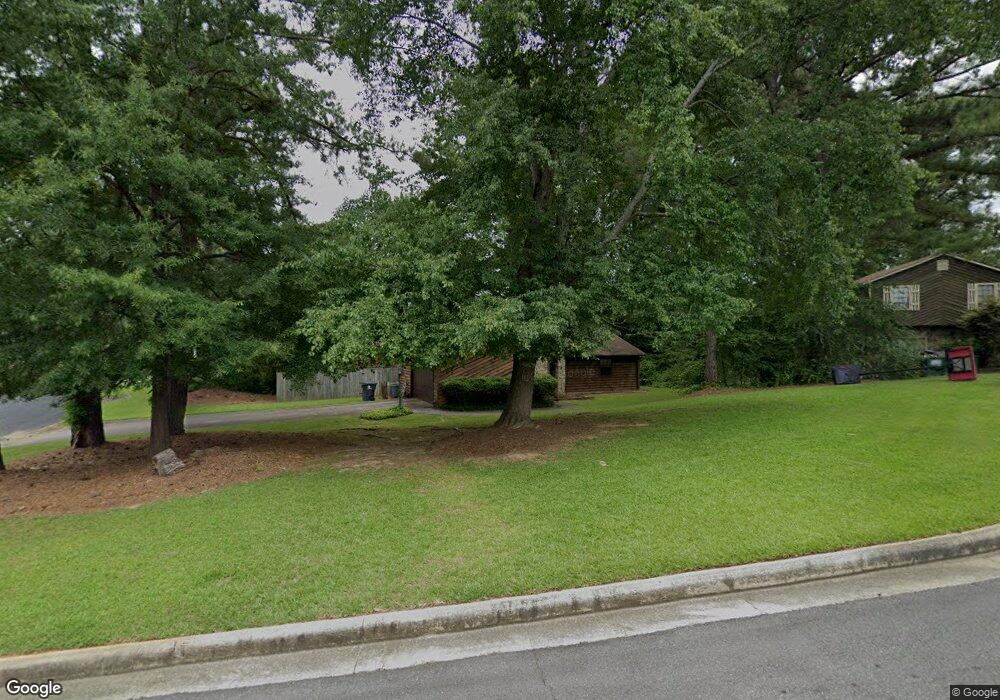
415 Crest Ct Unit 7 Jonesboro, GA 30238
Estimated Value: $210,000 - $227,000
3
Beds
2
Baths
1,361
Sq Ft
$161/Sq Ft
Est. Value
About This Home
This home is located at 415 Crest Ct Unit 7, Jonesboro, GA 30238 and is currently estimated at $218,703, approximately $160 per square foot. 415 Crest Ct Unit 7 is a home located in Clayton County with nearby schools including Kemp Primary School, Kemp Elementary School, and Pointe South Middle School.
Ownership History
Date
Name
Owned For
Owner Type
Purchase Details
Closed on
Jun 20, 2003
Sold by
Johnson Jamie A
Bought by
Moore April L
Current Estimated Value
Home Financials for this Owner
Home Financials are based on the most recent Mortgage that was taken out on this home.
Original Mortgage
$107,133
Outstanding Balance
$44,941
Interest Rate
5.43%
Mortgage Type
FHA
Estimated Equity
$173,762
Purchase Details
Closed on
May 15, 1998
Sold by
Dean Gregory D
Bought by
Johnson Jamie A
Home Financials for this Owner
Home Financials are based on the most recent Mortgage that was taken out on this home.
Original Mortgage
$82,900
Interest Rate
7%
Mortgage Type
VA
Purchase Details
Closed on
Sep 23, 1994
Sold by
Hood Gary E
Bought by
Dean Gregory D
Home Financials for this Owner
Home Financials are based on the most recent Mortgage that was taken out on this home.
Original Mortgage
$65,050
Interest Rate
8.56%
Create a Home Valuation Report for This Property
The Home Valuation Report is an in-depth analysis detailing your home's value as well as a comparison with similar homes in the area
Home Values in the Area
Average Home Value in this Area
Purchase History
| Date | Buyer | Sale Price | Title Company |
|---|---|---|---|
| Moore April L | $108,900 | -- | |
| Johnson Jamie A | $82,900 | -- | |
| Dean Gregory D | $68,500 | -- |
Source: Public Records
Mortgage History
| Date | Status | Borrower | Loan Amount |
|---|---|---|---|
| Open | Moore April L | $107,133 | |
| Previous Owner | Johnson Jamie A | $82,900 | |
| Previous Owner | Dean Gregory D | $65,050 |
Source: Public Records
Tax History Compared to Growth
Tax History
| Year | Tax Paid | Tax Assessment Tax Assessment Total Assessment is a certain percentage of the fair market value that is determined by local assessors to be the total taxable value of land and additions on the property. | Land | Improvement |
|---|---|---|---|---|
| 2025 | $2,918 | $86,200 | $7,200 | $79,000 |
| 2024 | $3,016 | $87,320 | $7,200 | $80,120 |
| 2023 | $2,773 | $76,800 | $7,200 | $69,600 |
| 2022 | $2,042 | $62,040 | $7,200 | $54,840 |
| 2021 | $1,608 | $50,720 | $7,200 | $43,520 |
| 2020 | $1,213 | $40,318 | $7,200 | $33,118 |
| 2019 | $980 | $34,145 | $5,600 | $28,545 |
| 2018 | $698 | $27,198 | $5,600 | $21,598 |
| 2017 | $521 | $22,805 | $5,600 | $17,205 |
| 2016 | $429 | $20,536 | $5,600 | $14,936 |
| 2015 | $357 | $0 | $0 | $0 |
| 2014 | $511 | $22,820 | $5,600 | $17,220 |
Source: Public Records
Map
Nearby Homes
- 9342 Thomas Rd
- 9404 Bogey Ct
- 9404 Cypress Ln
- 316 River Chase Dr
- 288 Country Club Dr
- 22 Fairview Dr
- 296 Country Club Dr
- 556 Country Greens Dr
- 299 Country Club Dr
- 237 Country Club Dr
- 281 Willow Springs Dr
- 9383 Woodknoll Way Unit 4
- 254 Country Club Dr
- 301 Deerfield Dr
- 9409 Forest Knoll Dr
- 273 Martin Dr
- 9556 Thomas Downs Ln Unit 1
- 251 River Chase Dr
- 259 Independence Dr Unit 4
- 345 Staten St
- 411 Crest Ct Unit 7
- 9383 Wood Knoll Ln
- 9383 Woodknoll Ln
- 9379 Crest Knoll Ct Unit 7
- 9375 Thomas Rd
- 9375 Woodknoll Ln Unit 7
- 9380 Crest Knoll Ct Unit 7
- 9367 Thomas Rd
- 407 Crest Ct
- 9383 Thomas Rd
- 9391 Thomas Rd
- 414 Crest Ct
- 408 Crest Ct
- 9387 Crest Knoll Ct
- 9369 Woodknoll Ln Unit 7
- 9369 Wood Knoll Ln
- 9384 Crest Knoll Ct Unit 7
- 9399 Thomas Rd
- 9382 Woodknoll Ln
- 9386 Wood Knoll Ln