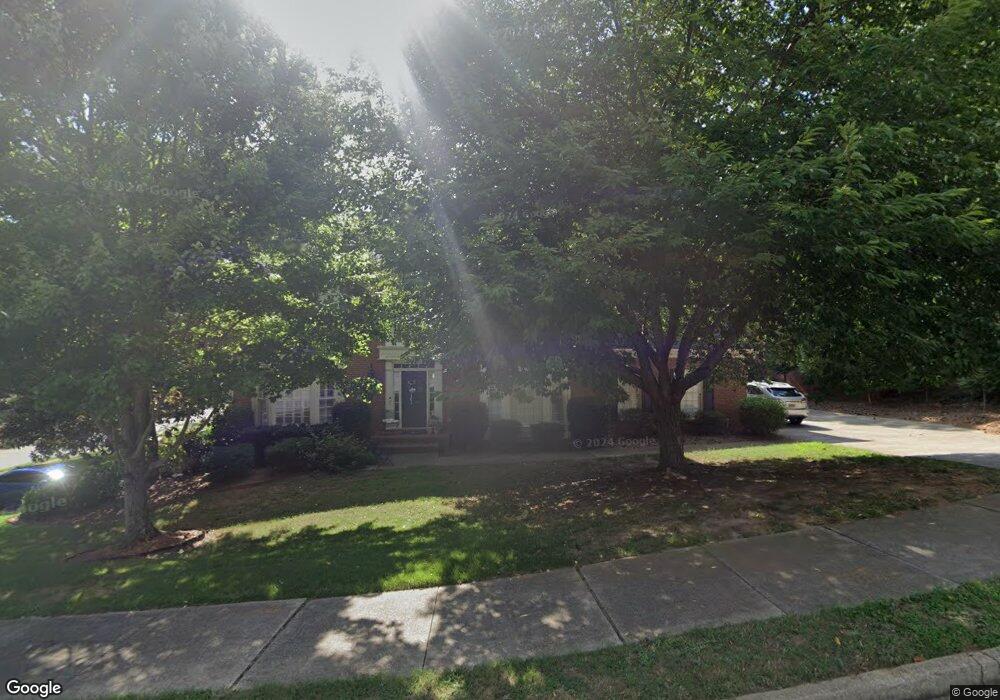
415 Cullen Copse Alpharetta, GA 30022
Newtown NeighborhoodEstimated Value: $752,000 - $843,000
4
Beds
4
Baths
3,175
Sq Ft
$249/Sq Ft
Est. Value
About This Home
This home is located at 415 Cullen Copse, Alpharetta, GA 30022 and is currently estimated at $790,577, approximately $249 per square foot. 415 Cullen Copse is a home located in Fulton County with nearby schools including Barnwell Elementary School, Haynes Bridge Middle School, and Centennial High School.
Ownership History
Date
Name
Owned For
Owner Type
Purchase Details
Closed on
Apr 15, 2025
Sold by
Sevy Jerry
Bought by
Sevy Jerry and Sevy Jorita A
Current Estimated Value
Purchase Details
Closed on
Dec 23, 2011
Sold by
Sevy Jerry
Bought by
Sevy Jerry and Sevy Jorita A
Purchase Details
Closed on
May 3, 2002
Sold by
Choi and Choi Feng Chin
Bought by
Sevy Jerry
Home Financials for this Owner
Home Financials are based on the most recent Mortgage that was taken out on this home.
Original Mortgage
$210,000
Interest Rate
7.12%
Mortgage Type
New Conventional
Purchase Details
Closed on
Nov 16, 1994
Sold by
White Ferrell E Patricia
Bought by
Choi Feng Chin and Feng Daan
Home Financials for this Owner
Home Financials are based on the most recent Mortgage that was taken out on this home.
Original Mortgage
$196,000
Interest Rate
9.01%
Create a Home Valuation Report for This Property
The Home Valuation Report is an in-depth analysis detailing your home's value as well as a comparison with similar homes in the area
Home Values in the Area
Average Home Value in this Area
Purchase History
| Date | Buyer | Sale Price | Title Company |
|---|---|---|---|
| Sevy Jerry | -- | -- | |
| Sevy Jerry | -- | -- | |
| Sevy Jerry | $328,400 | -- | |
| Choi Feng Chin | $245,000 | -- |
Source: Public Records
Mortgage History
| Date | Status | Borrower | Loan Amount |
|---|---|---|---|
| Previous Owner | Sevy Jerry | $210,000 | |
| Previous Owner | Choi Feng Chin | $196,000 |
Source: Public Records
Tax History Compared to Growth
Tax History
| Year | Tax Paid | Tax Assessment Tax Assessment Total Assessment is a certain percentage of the fair market value that is determined by local assessors to be the total taxable value of land and additions on the property. | Land | Improvement |
|---|---|---|---|---|
| 2025 | $5,458 | $268,000 | $59,640 | $208,360 |
| 2023 | $5,458 | $254,840 | $71,840 | $183,000 |
| 2022 | $5,229 | $219,120 | $48,120 | $171,000 |
| 2021 | $5,179 | $183,000 | $39,240 | $143,760 |
| 2020 | $5,237 | $210,640 | $40,280 | $170,360 |
| 2019 | $631 | $192,960 | $35,840 | $157,120 |
| 2018 | $5,047 | $167,720 | $31,200 | $136,520 |
| 2017 | $5,167 | $164,520 | $27,640 | $136,880 |
| 2016 | $5,063 | $164,520 | $27,640 | $136,880 |
| 2015 | $5,117 | $164,520 | $27,640 | $136,880 |
| 2014 | $4,078 | $128,680 | $37,080 | $91,600 |
Source: Public Records
Map
Nearby Homes
- 3450 Merganser Ln
- 9510 Stoney Ridge Ln
- 3535 Merganser Ln Unit 2
- 9675 Almaviva Dr
- 710 Leeds Garden Terrace
- 140 Old Sandhurst Landing
- 9695 Almaviva Dr
- 835 Kings Arms Way
- 9715 Almaviva Dr
- 150 Stoney Ridge Dr
- 9320 Brumbelow Crossing Way
- 440 Guildhall Grove Unit 2
- 615 S Preston Ct
- 375 N Peak Dr
- 2910 Leeds Garden Ln
- 545 Oak Bridge Trail
- 595 Oak Alley Way
- 280 Vidaulan Ct
- 425 Cullen Copse
- 425 Cullen Copse Unit 425
- 0 Cullen Copse Unit 7309380
- 405 Cullen Copse
- 435 Cullen Copse
- 440 Cullen Copse
- 3265 Kingshouse Commons
- 400 Cullen Copse
- 430 Cullen Copse
- 450 Cullen Copse
- 410 Cullen Copse
- 460 Cullen Copse
- 420 Cullen Copse
- 445 Cullen Copse
- 305 Loch Tay Way
- 130 Knighthood Ct
- 140 Knighthood Ct
- 455 Cullen Copse
- 3290 Kingshouse Commons
- 120 Knighthood Ct