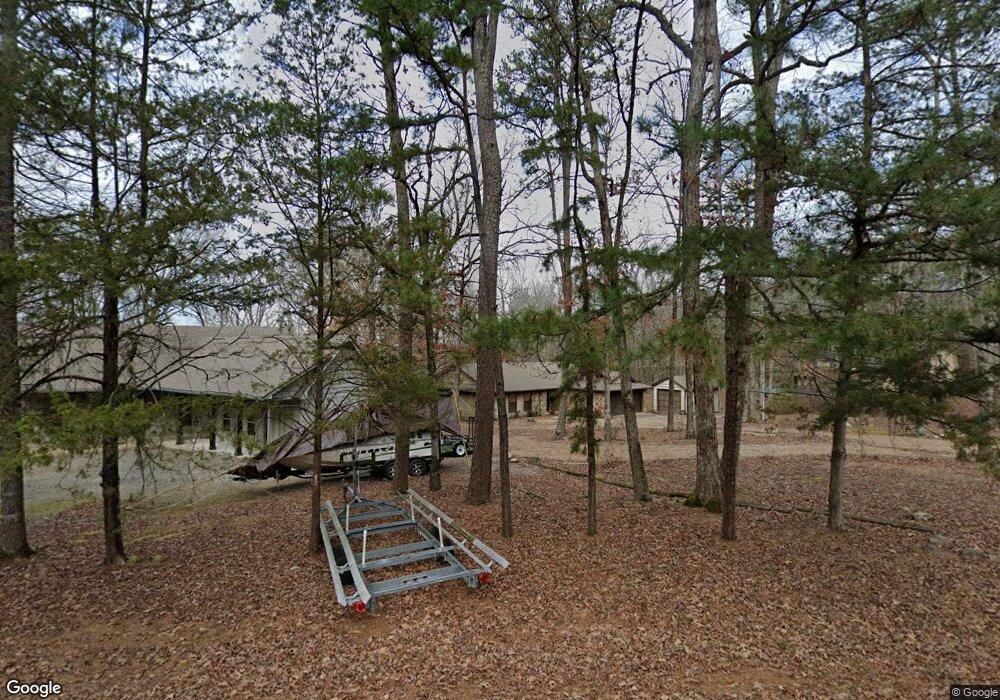
415 Dike View Dr Heber Springs, AR 72543
Estimated Value: $314,000 - $508,000
--
Bed
3
Baths
1,654
Sq Ft
$244/Sq Ft
Est. Value
About This Home
This home is located at 415 Dike View Dr, Heber Springs, AR 72543 and is currently estimated at $403,332, approximately $243 per square foot. 415 Dike View Dr is a home located in Cleburne County with nearby schools including Heber Springs Elementary School, Heber Springs Middle School, and Heber Springs High School.
Ownership History
Date
Name
Owned For
Owner Type
Purchase Details
Closed on
Nov 8, 2024
Sold by
Joyner Steven and Joyner Vicki
Bought by
Steven & Vicki Joyner Properties Llc
Current Estimated Value
Purchase Details
Closed on
May 3, 2024
Sold by
T B & B Properties Llc
Bought by
Joyner Steven and Joyner Vicki
Purchase Details
Closed on
Feb 11, 2005
Sold by
Ferguson John K and Ferguson Doris M
Bought by
T B & B Properties Llc
Home Financials for this Owner
Home Financials are based on the most recent Mortgage that was taken out on this home.
Original Mortgage
$220,000
Interest Rate
5.78%
Mortgage Type
Future Advance Clause Open End Mortgage
Purchase Details
Closed on
Feb 1, 1992
Bought by
Ferguson, John &Doris Trustees
Create a Home Valuation Report for This Property
The Home Valuation Report is an in-depth analysis detailing your home's value as well as a comparison with similar homes in the area
Home Values in the Area
Average Home Value in this Area
Purchase History
| Date | Buyer | Sale Price | Title Company |
|---|---|---|---|
| Steven & Vicki Joyner Properties Llc | $250,000 | Professional Land Title | |
| Steven & Vicki Joyner Properties Llc | $250,000 | Professional Land Title | |
| Joyner Steven | -- | None Listed On Document | |
| T B & B Properties Llc | $235,000 | -- | |
| Ferguson, John &Doris Trustees | -- | -- |
Source: Public Records
Mortgage History
| Date | Status | Borrower | Loan Amount |
|---|---|---|---|
| Previous Owner | T B & B Properties Llc | $220,000 |
Source: Public Records
Tax History Compared to Growth
Tax History
| Year | Tax Paid | Tax Assessment Tax Assessment Total Assessment is a certain percentage of the fair market value that is determined by local assessors to be the total taxable value of land and additions on the property. | Land | Improvement |
|---|---|---|---|---|
| 2025 | $2,667 | $70,372 | $11,000 | $59,372 |
| 2024 | $1,917 | $50,588 | $11,000 | $39,588 |
| 2023 | $1,991 | $52,526 | $11,000 | $41,526 |
| 2022 | $1,988 | $52,526 | $11,000 | $41,526 |
| 2021 | $1,813 | $46,249 | $15,000 | $31,249 |
| 2020 | $1,813 | $46,249 | $15,000 | $31,249 |
| 2019 | $1,753 | $46,249 | $15,000 | $31,249 |
| 2018 | $1,753 | $46,249 | $15,000 | $31,249 |
| 2017 | $1,753 | $46,249 | $15,000 | $31,249 |
| 2016 | $1,745 | $46,031 | $25,000 | $21,031 |
| 2015 | $1,664 | $43,918 | $22,887 | $21,031 |
| 2014 | $1,546 | $40,781 | $19,750 | $21,031 |
Source: Public Records
Map
Nearby Homes
- 149 Driftwood Trail
- 874 Stacy Springs Rd N
- 0 Pearson Rd Unit 25048478
- 0 Oak Ln Unit 25661265
- 250 Pine Dr
- 000 Pine
- 175 Juan Ln
- 9900 Arkansas 110
- 7 Driftwood Ln
- 5 Westpark Dr
- 54 Woodland Cove Dr
- 432 Ridgewood Dr
- Lot 35RR Country Club Add Eden Isle
- 9 Robinwood Cove Dr
- 425 Stony Ridge Rd
- 458 E Orchard Ct
- 448 Golf Dr
- 0 Baywood
- Tract 2 Pearson Rd
- Tract 3 Pearson Rd
- 405 Dike View Dr
- 449 Dike View Dr
- 414 Dike View Dr
- 440 Dike View Dr
- 450 Dike View Dr
- 499 Dike View Dr
- 474 Dike View Dr
- 375 Dike View Dr
- 399 Dike View Dr
- 374 Dike View Dr
- 355 Dike View Dr
- 348 Dike View Dr
- 359 Dike View Dr
- 555 Dike View Dr
- 346 Dike View Dr
- 324 Dike View Dr
- 560 Dike View Dr
- 529 Big Dike Rd
- 0 Dike View Dr Unit 24042425
- Lot 34 Dike View Dr