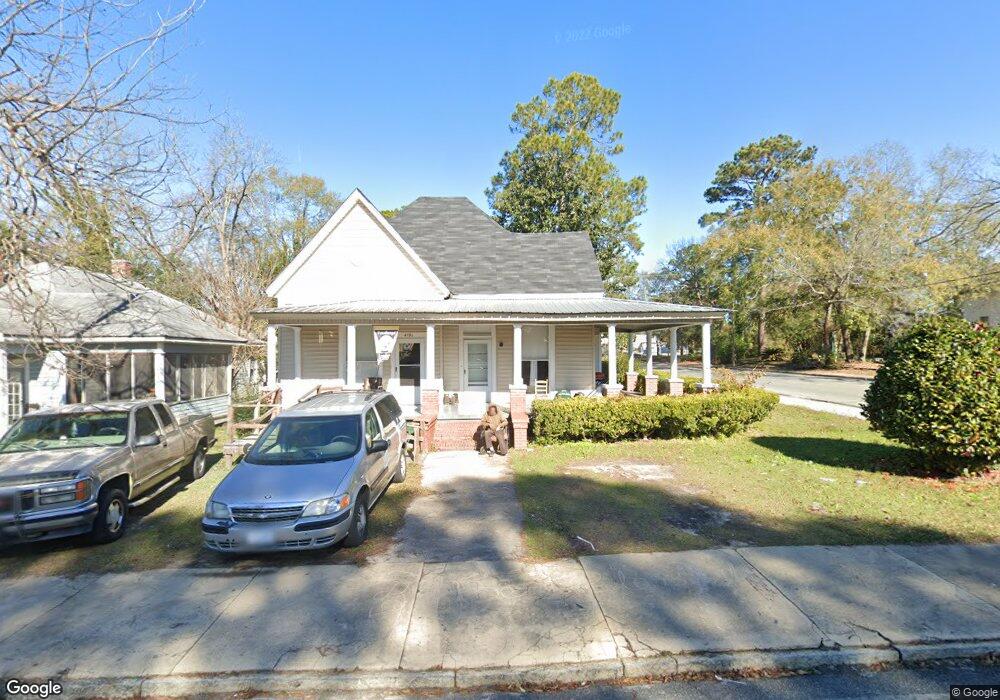
415 E 12th Ave Cordele, GA 31015
Estimated Value: $90,699 - $375,000
3
Beds
2
Baths
1,932
Sq Ft
$86/Sq Ft
Est. Value
About This Home
This home is located at 415 E 12th Ave, Cordele, GA 31015 and is currently estimated at $166,925, approximately $86 per square foot. 415 E 12th Ave is a home located in Crisp County with nearby schools including Crisp County Elementary School, Crisp County Primary School, and Crisp County Middle School.
Ownership History
Date
Name
Owned For
Owner Type
Purchase Details
Closed on
Jan 1, 2009
Sold by
H & H Group Properties Llc
Bought by
H & H Group Properties Llc
Current Estimated Value
Purchase Details
Closed on
Jan 1, 2008
Sold by
H&H Group Propertiesllc
Bought by
H & H Group Properties Llc
Purchase Details
Closed on
Jul 7, 2006
Sold by
H & H Grp Properties Llc
Bought by
Pate Sandra C
Purchase Details
Closed on
Jun 25, 2003
Sold by
Hobbs Martha D
Bought by
H&H Group Propertiesllc
Purchase Details
Closed on
May 12, 1997
Sold by
Hobbs Martha D
Bought by
Hobbs Martha D
Purchase Details
Closed on
Nov 10, 1995
Sold by
Hobbs James L
Bought by
Hobbs Martha D
Purchase Details
Closed on
Jun 15, 1972
Sold by
Stephens Miss Leona
Bought by
Hobbs James L
Purchase Details
Closed on
Oct 3, 1944
Bought by
Stephens Miss Leona
Create a Home Valuation Report for This Property
The Home Valuation Report is an in-depth analysis detailing your home's value as well as a comparison with similar homes in the area
Purchase History
| Date | Buyer | Sale Price | Title Company |
|---|---|---|---|
| H & H Group Properties Llc | $69,900 | -- | |
| H & H Group Properties Llc | $72,900 | -- | |
| Pate Sandra C | $85,000 | -- | |
| H&H Group Propertiesllc | $57,000 | -- | |
| Hobbs Martha D | -- | -- | |
| Hobbs Martha D | -- | -- | |
| Hobbs James L | -- | -- | |
| Stephens Miss Leona | -- | -- |
Source: Public Records
Tax History
| Year | Tax Paid | Tax Assessment Tax Assessment Total Assessment is a certain percentage of the fair market value that is determined by local assessors to be the total taxable value of land and additions on the property. | Land | Improvement |
|---|---|---|---|---|
| 2025 | $1,386 | $39,289 | $2,500 | $36,789 |
| 2024 | $826 | $23,041 | $2,364 | $20,677 |
| 2023 | $864 | $23,041 | $2,364 | $20,677 |
| 2022 | $718 | $31,944 | $2,500 | $29,444 |
| 2021 | $840 | $21,514 | $1,786 | $19,728 |
| 2020 | $606 | $21,514 | $1,786 | $19,728 |
| 2019 | $610 | $30,108 | $2,500 | $27,608 |
| 2018 | $506 | $17,180 | $2,500 | $14,680 |
| 2017 | $698 | $17,180 | $2,500 | $14,680 |
| 2016 | $508 | $17,180 | $2,500 | $14,680 |
| 2015 | -- | $17,180 | $2,500 | $14,680 |
| 2014 | -- | $17,180 | $2,500 | $14,680 |
| 2013 | -- | $17,180 | $2,500 | $14,680 |
Source: Public Records
Map
Nearby Homes
Your Personal Tour Guide
Ask me questions while you tour the home.