R
Landlord's Agent in 2024
Randy Duerst
Elm Real Estate
(630) 834-7700

Estimated Value: $518,000 - $640,000
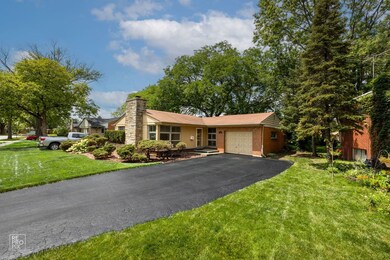
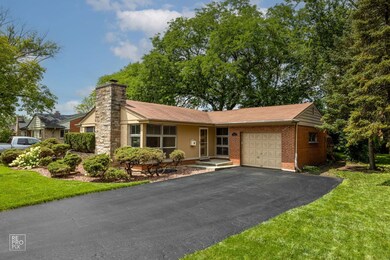
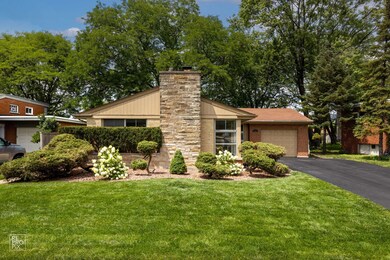
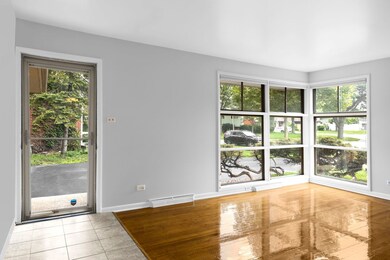
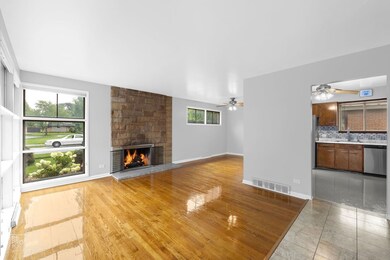
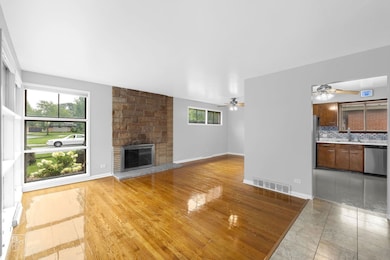
ALL BRICK RANCH IN BRYNHAVEN SUBDIVISION IN SOUTH ELMHURST. 3 BEDROOMS, 1.5 BATHROOMS. GREAT LOCATION ON QUIET STREET ACROSS FRON CUL-DE-SAC. HARDWOOD FLOORS THROUGHOUT, EAT-IN KITCHEN WITH STAINLESS STEEL APPLIANCES ( 1 YEAR OLD NEWER SS REFRIGERATOR IN KITCHEN AND BASEMENT AND DISHWASHER ) AND SEPARATE DINING ROOM FOR LARGE TABLE, GAS FIREPLACE IN LIVING ROOM, LARGE FINISHED BASEMENT HAS LOTS OF WINDOWS THAT HAS LOTS OF NATURAL LIGHT, BAR WITH NEWER SS REFRIGERATOR, NEWER FURNACE & CENTRAL AIR, BRUNSWICK SLATE POOL TABLE THAT STAYS, SMALL OFFICE AREA IN LAUNDRY ROOM POSSIBLE AND LARGE STORAGE AREA. 1ST FLOOR SQUARE FOOTAGE IS ABOUT 1,250 SF AND THE FINISHED BASEMENT IS ABOUT 1,250 SF FOR A TOTAL ABOUT 2,500 SF. LARGE PATIO & PRIVATE YARD WITH LOST OF TREES & BUSHES ( 71 X 155 FT LOT SIZE ), SHORT WALK TO EDISON & SANDBURG SCHOOLS. {ABOUT 8 HOUSES } CLOSE TO EXPRESSWAYS, TOWN & TRAIN ABOUT 1 MILE TO TOWN & TRAIN WITH ALL THAT DOWNTOWN ELMHURST HAS TO OFFER. HIGHY RATED SCHOOLS IN SOUTH ELMHURST. LONG TERM POSSIBLE AS HOUSE IS NOT FOR SALE OR A TEAR DOWN. NO PETS PREFFERED BUT NEGOTIABLE ON A CASE BY CASE BASIS WITH ADDITIONAL DEPOSIT.
Last Agent to Rent the Property
Elm Real Estate License #471003453 Listed on: 07/05/2024
| Date | Event | Price | List to Sale | Price per Sq Ft |
|---|---|---|---|---|
| 07/26/2024 07/26/24 | Rented | $2,900 | -3.3% | -- |
| 07/05/2024 07/05/24 | For Rent | $3,000 | +36.4% | -- |
| 09/21/2020 09/21/20 | Rented | $2,200 | -4.3% | -- |
| 09/06/2020 09/06/20 | Under Contract | -- | -- | -- |
| 09/03/2020 09/03/20 | For Rent | $2,300 | -- | -- |
| Year | Tax Paid | Tax Assessment Tax Assessment Total Assessment is a certain percentage of the fair market value that is determined by local assessors to be the total taxable value of land and additions on the property. | Land | Improvement |
|---|---|---|---|---|
| 2024 | $7,604 | $126,166 | $109,913 | $16,253 |
| 2023 | $7,083 | $116,670 | $101,640 | $15,030 |
| 2022 | $7,076 | $116,690 | $97,710 | $18,980 |
| 2021 | $6,907 | $113,790 | $95,280 | $18,510 |
| 2020 | $6,645 | $111,290 | $93,190 | $18,100 |
| 2019 | $6,518 | $105,810 | $88,600 | $17,210 |
| 2018 | $6,993 | $112,880 | $83,880 | $29,000 |
| 2017 | $7,636 | $119,840 | $79,930 | $39,910 |
| 2016 | $7,494 | $112,900 | $75,300 | $37,600 |
| 2015 | $7,444 | $105,180 | $70,150 | $35,030 |
| 2014 | $5,994 | $77,780 | $55,680 | $22,100 |
| 2013 | $5,924 | $78,870 | $56,460 | $22,410 |
R
Landlord's Agent in 2024
Randy Duerst
Elm Real Estate
(630) 834-7700

Tenant's Agent in 2024
Melvin Gonzalez
Kale Realty
(312) 561-1452
6 Total Sales
Buyer's Agent in 2020
Dan Muisenga
Berkshire Hathaway HomeServices Prairie Path REALT
(630) 640-9255
26 in this area
38 Total Sales
Source: Midwest Real Estate Data (MRED)
MLS Number: 11859594
APN: 06-01-406-048
Disclaimer: Certain information contained herein is derived from information provided by parties other than Homes.com. All information provided is deemed reliable, but is not guaranteed to be accurate and should be independently verified.
![]() Based on information submitted to the MLS GRID. All data is obtained from various sources and may not have been verified by broker or MLS GRID. Supplied Open House Information is subject to change without notice. All information should be independently reviewed and verified for accuracy. Properties may or may not be listed by the office/agent presenting the information. Some IDX listings have been excluded from this website.
Based on information submitted to the MLS GRID. All data is obtained from various sources and may not have been verified by broker or MLS GRID. Supplied Open House Information is subject to change without notice. All information should be independently reviewed and verified for accuracy. Properties may or may not be listed by the office/agent presenting the information. Some IDX listings have been excluded from this website.
Based on information submitted to the MLS GRID
Ask me questions while you tour the home.