Estimated Value: $101,000 - $168,000
3
Beds
2
Baths
1,215
Sq Ft
$108/Sq Ft
Est. Value
About This Home
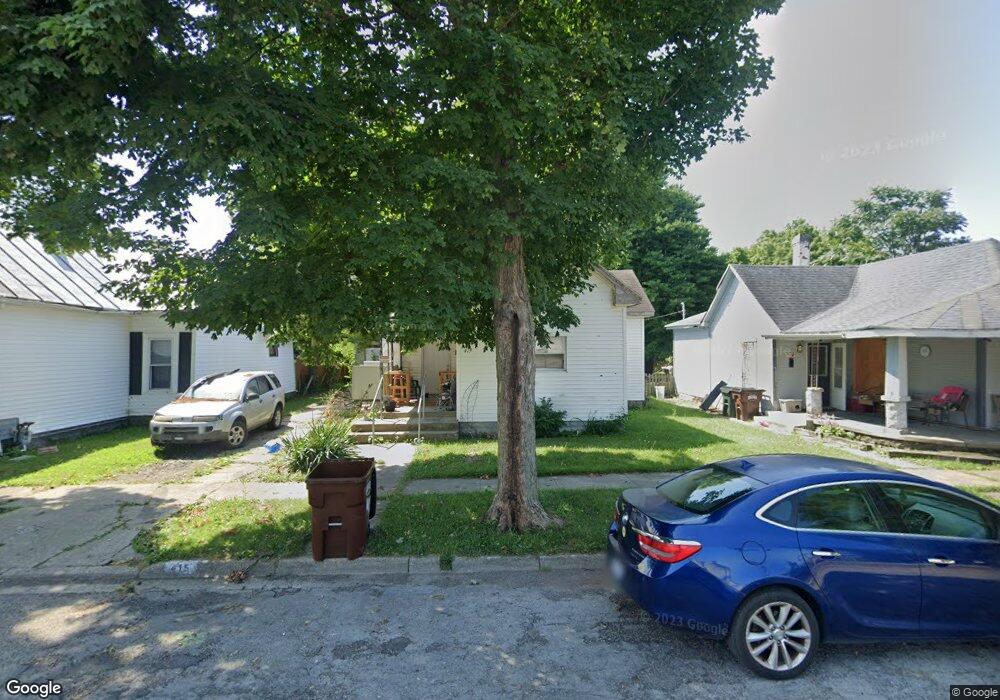
This home is located at 415 Elm St, Xenia, OH 45385 and is currently estimated at $131,413, approximately $108 per square foot. 415 Elm St is a home located in Greene County with nearby schools including Xenia High School, Summit Academy Community School for Alternative Learners - Xenia, and Legacy Christian Academy.
Ownership History
Date
Name
Owned For
Owner Type
Purchase Details
Closed on
Mar 21, 2025
Sold by
Gardner Nancy and Shaw Nancy Gale
Bought by
Cloud Joe L and Cloud Amy M
Current Estimated Value
Home Financials for this Owner
Home Financials are based on the most recent Mortgage that was taken out on this home.
Original Mortgage
$140,000
Outstanding Balance
$101,507
Interest Rate
6.09%
Mortgage Type
Seller Take Back
Estimated Equity
$29,906
Purchase Details
Closed on
Oct 26, 2020
Sold by
Estate Of Charles L Shaw
Bought by
Shaw Nancy Gale
Create a Home Valuation Report for This Property
The Home Valuation Report is an in-depth analysis detailing your home's value as well as a comparison with similar homes in the area
Home Values in the Area
Average Home Value in this Area
Purchase History
| Date | Buyer | Sale Price | Title Company |
|---|---|---|---|
| Cloud Joe L | $160,000 | None Listed On Document | |
| Shaw Nancy Gale | -- | None Available |
Source: Public Records
Mortgage History
| Date | Status | Borrower | Loan Amount |
|---|---|---|---|
| Open | Cloud Joe L | $140,000 |
Source: Public Records
Tax History Compared to Growth
Tax History
| Year | Tax Paid | Tax Assessment Tax Assessment Total Assessment is a certain percentage of the fair market value that is determined by local assessors to be the total taxable value of land and additions on the property. | Land | Improvement |
|---|---|---|---|---|
| 2024 | $1,033 | $22,980 | $4,810 | $18,170 |
| 2023 | $983 | $22,980 | $4,810 | $18,170 |
| 2022 | $872 | $17,380 | $3,850 | $13,530 |
| 2021 | $884 | $17,380 | $3,850 | $13,530 |
| 2020 | $847 | $17,380 | $3,850 | $13,530 |
| 2019 | $668 | $12,910 | $4,000 | $8,910 |
| 2018 | $671 | $12,910 | $4,000 | $8,910 |
| 2017 | $651 | $12,910 | $4,000 | $8,910 |
| 2016 | $649 | $12,260 | $4,000 | $8,260 |
| 2015 | $651 | $12,260 | $4,000 | $8,260 |
| 2014 | $623 | $12,260 | $4,000 | $8,260 |
Source: Public Records
Map
Nearby Homes