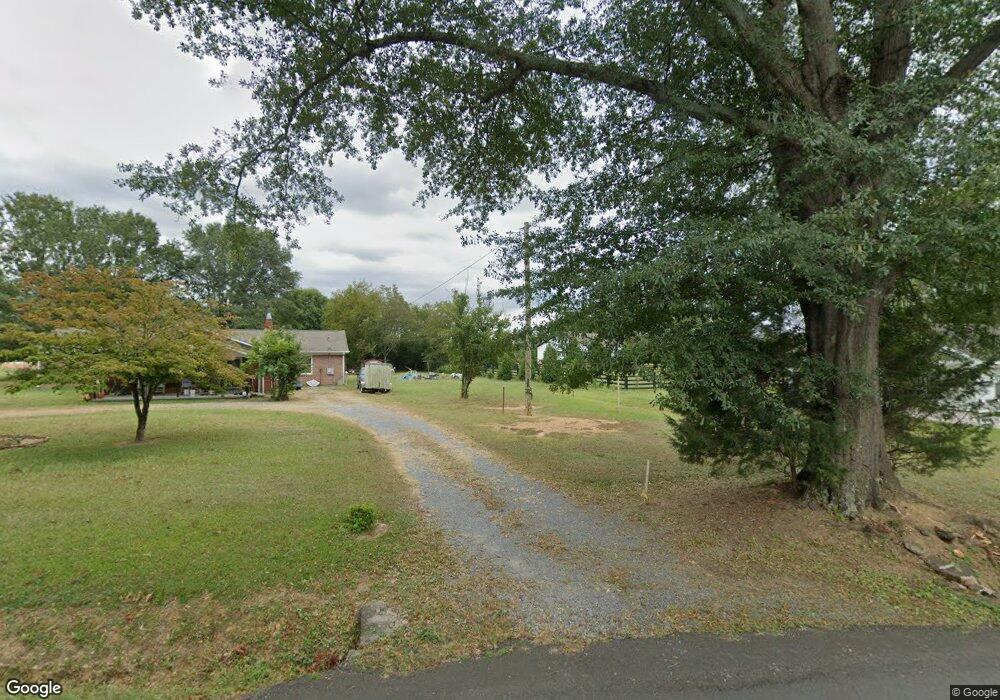
415 Fite Bend Rd NE Resaca, GA 30735
Estimated Value: $265,822 - $341,000
3
Beds
3
Baths
2,334
Sq Ft
$130/Sq Ft
Est. Value
About This Home
This home is located at 415 Fite Bend Rd NE, Resaca, GA 30735 and is currently estimated at $303,956, approximately $130 per square foot. 415 Fite Bend Rd NE is a home located in Gordon County with nearby schools including Tolbert Elementary School, Ashworth Middle School, and Gordon Central High School.
Ownership History
Date
Name
Owned For
Owner Type
Purchase Details
Closed on
Apr 7, 2021
Sold by
Croy Herschel
Bought by
Croy Herschel and Croy Glenda June
Current Estimated Value
Home Financials for this Owner
Home Financials are based on the most recent Mortgage that was taken out on this home.
Original Mortgage
$142,000
Outstanding Balance
$128,311
Interest Rate
3.05%
Mortgage Type
New Conventional
Estimated Equity
$175,645
Purchase Details
Closed on
Aug 12, 2020
Sold by
Croy Herschel
Bought by
Croy Herschel
Purchase Details
Closed on
Jun 18, 2009
Sold by
Croy Herschel
Bought by
Croy Herschel and Croy Glenda J
Home Financials for this Owner
Home Financials are based on the most recent Mortgage that was taken out on this home.
Original Mortgage
$127,551
Interest Rate
4.79%
Mortgage Type
New Conventional
Purchase Details
Closed on
Jul 3, 1997
Bought by
Cash Ruth
Create a Home Valuation Report for This Property
The Home Valuation Report is an in-depth analysis detailing your home's value as well as a comparison with similar homes in the area
Home Values in the Area
Average Home Value in this Area
Purchase History
| Date | Buyer | Sale Price | Title Company |
|---|---|---|---|
| Croy Herschel | -- | -- | |
| Croy Herschel | -- | -- | |
| Croy Herschel | -- | -- | |
| Croy Herschel | $125,000 | -- | |
| Cash Ruth | $68,000 | -- |
Source: Public Records
Mortgage History
| Date | Status | Borrower | Loan Amount |
|---|---|---|---|
| Open | Croy Herschel | $142,000 | |
| Previous Owner | Croy Herschel | $127,551 |
Source: Public Records
Tax History Compared to Growth
Tax History
| Year | Tax Paid | Tax Assessment Tax Assessment Total Assessment is a certain percentage of the fair market value that is determined by local assessors to be the total taxable value of land and additions on the property. | Land | Improvement |
|---|---|---|---|---|
| 2024 | $721 | $81,720 | $2,400 | $79,320 |
| 2023 | $668 | $75,920 | $2,400 | $73,520 |
| 2022 | $653 | $70,640 | $2,400 | $68,240 |
| 2021 | $524 | $57,080 | $2,400 | $54,680 |
| 2020 | $536 | $57,880 | $2,400 | $55,480 |
| 2019 | $1,065 | $38,960 | $2,400 | $36,560 |
| 2018 | $995 | $36,560 | $2,400 | $34,160 |
| 2017 | $960 | $34,400 | $2,400 | $32,000 |
| 2016 | $962 | $34,400 | $2,400 | $32,000 |
| 2015 | $950 | $33,680 | $2,400 | $31,280 |
| 2014 | $899 | $32,886 | $2,424 | $30,462 |
Source: Public Records
Map
Nearby Homes
- 621 Nicklesville Rd NE
- 669 Nicklesville Rd NE
- 0 Pinecrest Dr NE
- 2796 U S 41
- 146 Causby Ln NW
- 157 Chance Dr NW
- 2630 Chatsworth Highway 225 NE
- 548 Corinth Rd NE
- 246 Defoor Rd NE
- 101 Brexley Dr
- 148 Brexley Dr
- 136 Brexley Dr
- 126 Brexley Dr
- 130 Brexley Dr
- 132 Brexley Dr
- 107 Brexley Dr
- 146 Brexley Dr
- 105 Brexley Dr
- 103 Brexley Dr
- 113 Brexley Dr
- 407 Fite Bend Rd NE
- 121 Swan Dr NE
- 418 Fite Bend Rd NE
- 139 Swan Dr NE
- 402 Fite Bend Rd NE
- 132 Swan Dr NE
- 149 Swan Dr NE
- 437 Fite Bend Rd NE
- 440 Fite Bend Rd NE
- 363 Fite Bend Rd NE
- 488 Fite Bend Rd NE
- 380 Fite Bend Rd NE
- 349 Fite Bend Rd NE
- 349 Fite Bend Rd NE
- 390 Fite Bend Rd NE
- 162 Swan Dr NE
- 382 Fite Bend Rd NE
- 508 Fite Bend Rd NE
- 358 Fite Bend Rd NE
- 535 Fite Bend Rd NE