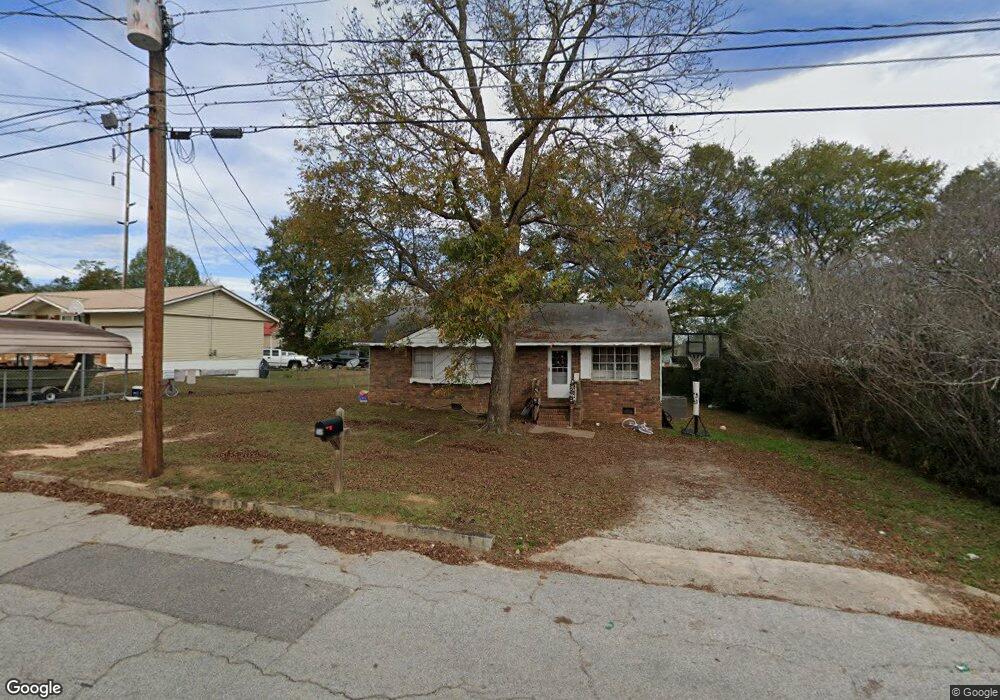
415 Hillcrest Ave Elberton, GA 30635
Estimated Value: $100,000 - $164,000
--
Bed
2
Baths
1,000
Sq Ft
$127/Sq Ft
Est. Value
About This Home
This home is located at 415 Hillcrest Ave, Elberton, GA 30635 and is currently estimated at $127,408, approximately $127 per square foot. 415 Hillcrest Ave is a home located in Elbert County with nearby schools including Elbert County Primary School, Elbert County Elementary School, and Elbert County Middle School.
Ownership History
Date
Name
Owned For
Owner Type
Purchase Details
Closed on
Nov 6, 2007
Sold by
Tench David W
Bought by
Suite Home Ventures Llc
Current Estimated Value
Purchase Details
Closed on
Mar 31, 2005
Sold by
Dove Christine Mullenix
Bought by
Stovall Jack Brent and Partain Dena S
Home Financials for this Owner
Home Financials are based on the most recent Mortgage that was taken out on this home.
Original Mortgage
$31,500
Interest Rate
5.62%
Purchase Details
Closed on
Mar 25, 2005
Sold by
Stovall Jack Brent
Bought by
Tench David W and Tench Christine L
Home Financials for this Owner
Home Financials are based on the most recent Mortgage that was taken out on this home.
Original Mortgage
$31,500
Interest Rate
5.62%
Purchase Details
Closed on
Sep 18, 2000
Sold by
Winchester Rosa Est
Bought by
Mullenix Chris
Purchase Details
Closed on
May 1, 1977
Purchase Details
Closed on
Oct 1, 1976
Purchase Details
Closed on
Dec 1, 1973
Purchase Details
Closed on
Mar 1, 1973
Create a Home Valuation Report for This Property
The Home Valuation Report is an in-depth analysis detailing your home's value as well as a comparison with similar homes in the area
Home Values in the Area
Average Home Value in this Area
Purchase History
| Date | Buyer | Sale Price | Title Company |
|---|---|---|---|
| Suite Home Ventures Llc | -- | -- | |
| Stovall Jack Brent | -- | -- | |
| Tench David W | $35,000 | -- | |
| Mullenix Chris | $37,000 | -- | |
| -- | $16,600 | -- | |
| -- | $14,000 | -- | |
| -- | -- | -- | |
| -- | $15,100 | -- |
Source: Public Records
Mortgage History
| Date | Status | Borrower | Loan Amount |
|---|---|---|---|
| Previous Owner | Tench David W | $31,500 |
Source: Public Records
Tax History Compared to Growth
Tax History
| Year | Tax Paid | Tax Assessment Tax Assessment Total Assessment is a certain percentage of the fair market value that is determined by local assessors to be the total taxable value of land and additions on the property. | Land | Improvement |
|---|---|---|---|---|
| 2024 | $918 | $37,331 | $2,811 | $34,520 |
| 2023 | $918 | $37,330 | $2,811 | $34,520 |
| 2022 | $521 | $21,159 | $2,811 | $18,348 |
| 2021 | $525 | $21,159 | $2,811 | $18,348 |
| 2020 | $491 | $17,786 | $3,123 | $14,663 |
| 2019 | $506 | $17,786 | $3,123 | $14,663 |
| 2018 | $595 | $20,442 | $3,123 | $17,319 |
| 2017 | $548 | $17,450 | $3,123 | $14,327 |
| 2016 | $512 | $17,450 | $3,123 | $14,327 |
| 2015 | -- | $17,450 | $3,123 | $14,327 |
| 2014 | -- | $17,450 | $3,123 | $14,327 |
| 2013 | -- | $17,450 | $3,123 | $14,327 |
Source: Public Records
Map
Nearby Homes
- 44 Clairmont Ave
- 346 N Oliver St
- 345 N Oliver St
- 1061 Porter Dr
- 968 Ext Elbert St
- 243 W Tate St
- 1020 Hickory Dr
- 214 Campbell St
- 89 College Ave
- 0 Sara Jane Dr Unit 10501253
- 105 S Thomas St
- 120 S Tusten St
- 1102 Williams Ln
- 245 Edwards St
- 62 Oak St
- 136 Forest Ave
- 252 Edwards St
- 1315 Pine Hill Dr
- 2790 Cedar Creek Rd
- 108 Brookhaven Cir
- 417 Hillcrest Ave
- 413 Hillcrest Ave
- 376 N Mcintosh St
- 356 N Mcintosh St
- 40 Clairmont Ave
- 36 Clairmont Ave
- 416 Hillcrest Ave
- 411 Hillcrest Ave
- 346 N Mcintosh St
- 418 Hillcrest Ave
- 375 N Mcintosh St
- 409 Hillcrest Ave
- 423 Hillcrest Ave
- 422 Hillcrest Ave
- 00000000 Hillcrest Ave
- 46 Clairmont Ave
- 39 Clairmont Ave
- 41 Clairmont Ave
- 424 Hillcrest Ave
- 37 Clairmont Ave