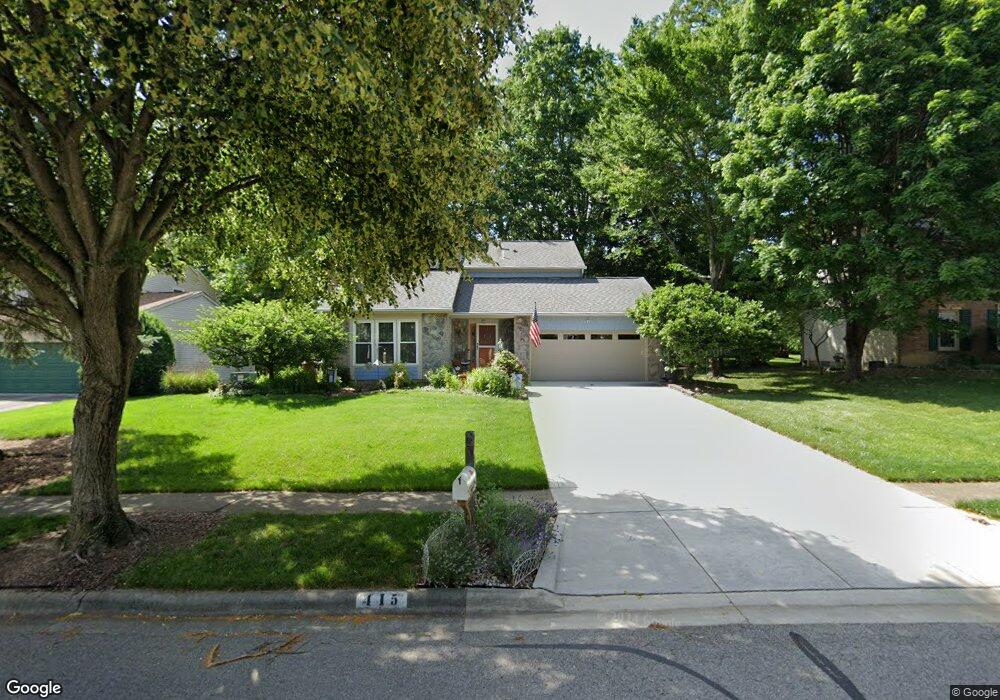
415 Howland Dr Columbus, OH 43230
Rathburn Woods NeighborhoodEstimated Value: $412,115 - $455,000
3
Beds
3
Baths
2,136
Sq Ft
$206/Sq Ft
Est. Value
About This Home
This home is located at 415 Howland Dr, Columbus, OH 43230 and is currently estimated at $439,029, approximately $205 per square foot. 415 Howland Dr is a home located in Franklin County with nearby schools including Lincoln Elementary School, Gahanna South Middle School, and Lincoln High School.
Ownership History
Date
Name
Owned For
Owner Type
Purchase Details
Closed on
May 20, 2005
Sold by
Mcginty Joanne M
Bought by
Schmitz Charles B and Schmitz Gloria F
Current Estimated Value
Home Financials for this Owner
Home Financials are based on the most recent Mortgage that was taken out on this home.
Original Mortgage
$160,000
Outstanding Balance
$81,635
Interest Rate
5.91%
Mortgage Type
Fannie Mae Freddie Mac
Estimated Equity
$357,394
Purchase Details
Closed on
Apr 22, 1999
Sold by
Miller Bruce F
Bought by
Mcginty Joanne M
Home Financials for this Owner
Home Financials are based on the most recent Mortgage that was taken out on this home.
Original Mortgage
$70,000
Interest Rate
7.17%
Purchase Details
Closed on
Jun 8, 1993
Bought by
Miller Bruce F
Purchase Details
Closed on
Nov 4, 1986
Create a Home Valuation Report for This Property
The Home Valuation Report is an in-depth analysis detailing your home's value as well as a comparison with similar homes in the area
Home Values in the Area
Average Home Value in this Area
Purchase History
| Date | Buyer | Sale Price | Title Company |
|---|---|---|---|
| Schmitz Charles B | $205,000 | -- | |
| Mcginty Joanne M | $162,500 | Chicago Title West | |
| Miller Bruce F | -- | -- | |
| -- | $110,500 | -- |
Source: Public Records
Mortgage History
| Date | Status | Borrower | Loan Amount |
|---|---|---|---|
| Open | Schmitz Charles B | $160,000 | |
| Closed | Mcginty Joanne M | $70,000 |
Source: Public Records
Tax History
| Year | Tax Paid | Tax Assessment Tax Assessment Total Assessment is a certain percentage of the fair market value that is determined by local assessors to be the total taxable value of land and additions on the property. | Land | Improvement |
|---|---|---|---|---|
| 2025 | $6,901 | $117,150 | $29,470 | $87,680 |
| 2024 | $6,901 | $117,150 | $29,470 | $87,680 |
| 2023 | $6,815 | $117,145 | $29,470 | $87,675 |
| 2022 | $6,537 | $87,540 | $12,950 | $74,590 |
| 2021 | $6,323 | $87,540 | $12,950 | $74,590 |
| 2020 | $6,270 | $87,540 | $12,950 | $74,590 |
| 2019 | $5,275 | $73,500 | $10,780 | $62,720 |
| 2018 | $5,166 | $73,500 | $10,780 | $62,720 |
| 2017 | $4,966 | $73,500 | $10,780 | $62,720 |
| 2016 | $5,091 | $70,390 | $17,430 | $52,960 |
| 2015 | $5,095 | $70,390 | $17,430 | $52,960 |
| 2014 | $5,056 | $70,390 | $17,430 | $52,960 |
| 2013 | $2,481 | $69,545 | $16,590 | $52,955 |
Source: Public Records
Map
Nearby Homes
- 352 Spruce Hill Dr
- 249 Farm Creek Dr
- 769 Ashford Glen Ct
- 701 Hunters Run
- 970 Claycraft Rd
- 875 Taylor Station Rd
- 5901 Stratton Place
- 62 Saint Stephens Ct
- 6976 Aiken Place Unit 26
- 6162 Stockton Trail Way
- 362 Hoskins Way
- 343 Flint Ridge Dr
- 324 Benedetti Ave
- 329 Cliffview Dr
- 169 Flint Ridge Dr
- 258 Rocky Fork Dr S
- 7040 Aly Dar Ln
- 1860 Unbridled Way
- 3440 Mann Rd
- 219 N Hamilton Rd
Your Personal Tour Guide
Ask me questions while you tour the home.