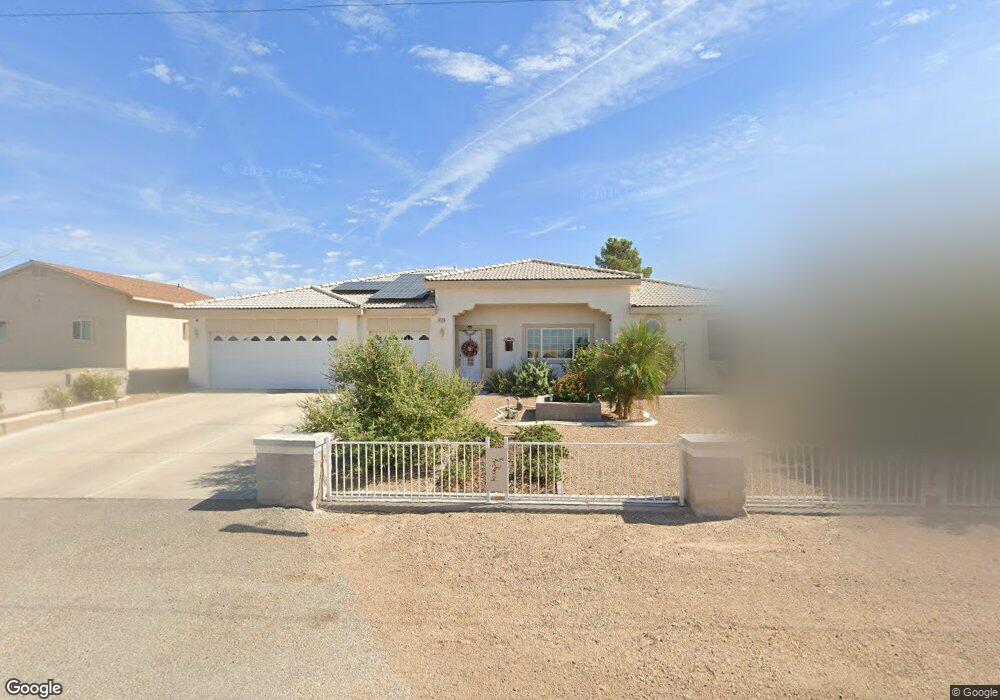
415 Jena St Henderson, NV 89015
Foothills NeighborhoodEstimated Value: $664,000 - $790,000
3
Beds
2
Baths
2,557
Sq Ft
$282/Sq Ft
Est. Value
About This Home
This home is located at 415 Jena St, Henderson, NV 89015 and is currently estimated at $721,516, approximately $282 per square foot. 415 Jena St is a home located in Clark County with nearby schools including C T Sewell Elementary School, B Mahlon Brown Academy of International Studies, and Basic Academy of International Studies.
Ownership History
Date
Name
Owned For
Owner Type
Purchase Details
Closed on
Jul 14, 2000
Sold by
Fiscus Larry E and Fiscus Bonnie J
Bought by
Fiscus Larry and Fiscus Bonnie
Current Estimated Value
Home Financials for this Owner
Home Financials are based on the most recent Mortgage that was taken out on this home.
Original Mortgage
$133,600
Outstanding Balance
$49,443
Interest Rate
8.37%
Estimated Equity
$672,073
Purchase Details
Closed on
Mar 29, 2000
Sold by
Lewis Robert A and Lewis Diane
Bought by
Fiscus Larry E and Fiscus Bonnie J
Create a Home Valuation Report for This Property
The Home Valuation Report is an in-depth analysis detailing your home's value as well as a comparison with similar homes in the area
Home Values in the Area
Average Home Value in this Area
Purchase History
| Date | Buyer | Sale Price | Title Company |
|---|---|---|---|
| Fiscus Larry | -- | First American Title Co | |
| Fiscus Larry E | $32,000 | First American Title Co |
Source: Public Records
Mortgage History
| Date | Status | Borrower | Loan Amount |
|---|---|---|---|
| Open | Fiscus Larry | $133,600 |
Source: Public Records
Tax History
| Year | Tax Paid | Tax Assessment Tax Assessment Total Assessment is a certain percentage of the fair market value that is determined by local assessors to be the total taxable value of land and additions on the property. | Land | Improvement |
|---|---|---|---|---|
| 2026 | $3,360 | $168,983 | $50,400 | $118,583 |
| 2025 | $3,261 | $168,728 | $47,250 | $121,478 |
| 2024 | $3,167 | $168,728 | $47,250 | $121,478 |
| 2023 | $3,167 | $161,062 | $47,250 | $113,812 |
| 2022 | $3,075 | $145,190 | $40,950 | $104,240 |
| 2021 | $2,985 | $136,961 | $37,800 | $99,161 |
| 2020 | $2,895 | $135,982 | $37,800 | $98,182 |
| 2019 | $2,811 | $124,913 | $28,350 | $96,563 |
| 2018 | $2,729 | $112,215 | $18,900 | $93,315 |
| 2017 | $3,295 | $113,673 | $18,900 | $94,773 |
| 2016 | $2,584 | $112,476 | $18,900 | $93,576 |
| 2015 | $2,579 | $97,777 | $14,000 | $83,777 |
| 2014 | $2,504 | $83,869 | $14,000 | $69,869 |
Source: Public Records
Map
Nearby Homes
- 0 N Kiel St
- 408 N Lisbon St
- 132 N Lisbon St
- 432 N Racetrack Rd
- 0 Firth Ave
- 504 Emden St
- 531 N Milan St
- 0 Dakar & Ithaca Unit 2746786
- 0 Essex Ave
- 0 N Magic Way
- 0 Emden St
- 421 Emily Crossing Ct
- 428 Emily Crossing Ct
- 259 N Milan St
- 0 Dublin Ave
- 252 Hull St
- 441 Milan St
- 0 N Pueblo Blvd
- 1190 Essex Ave
- 269 Aztec Ln
Your Personal Tour Guide
Ask me questions while you tour the home.