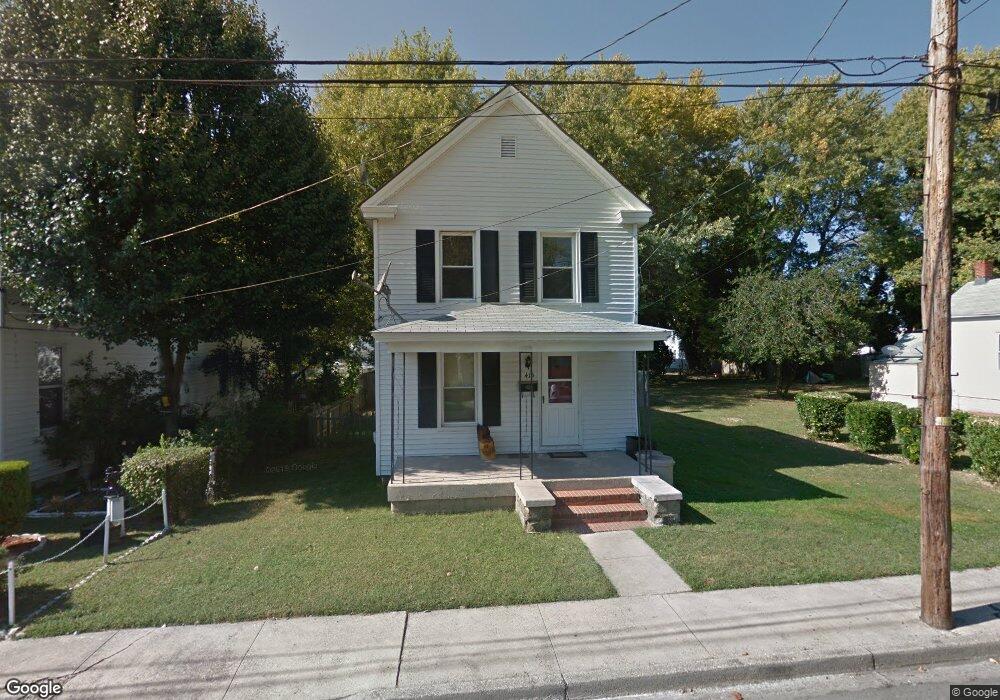
415 Linden Ave Cambridge, MD 21613
Estimated Value: $140,000 - $181,113
Studio
1
Bath
1,428
Sq Ft
$112/Sq Ft
Est. Value
About This Home
This home is located at 415 Linden Ave, Cambridge, MD 21613 and is currently estimated at $159,778, approximately $111 per square foot. 415 Linden Ave is a home located in Dorchester County with nearby schools including Sandy Hill Elementary School, Mace's Lane Middle School, and Cambridge-South Dorchester High School.
Ownership History
Date
Name
Owned For
Owner Type
Purchase Details
Closed on
Oct 31, 2002
Sold by
Salt & Light Co Inc
Bought by
Boyles Heather E
Current Estimated Value
Purchase Details
Closed on
May 17, 2002
Sold by
Commissioners Of Cambridge
Bought by
Salt & Light Co Inc
Purchase Details
Closed on
Apr 25, 2001
Sold by
Stack Vanessa D
Bought by
Secretary Of Housing & Urban
Purchase Details
Closed on
Jul 7, 1997
Sold by
Swaim Lillian S L and Then To E
Bought by
Stack Vanessa D
Create a Home Valuation Report for This Property
The Home Valuation Report is an in-depth analysis detailing your home's value as well as a comparison with similar homes in the area
Home Values in the Area
Average Home Value in this Area
Purchase History
| Date | Buyer | Sale Price | Title Company |
|---|---|---|---|
| Boyles Heather E | $60,000 | -- | |
| Salt & Light Co Inc | -- | -- | |
| Commissioners Of Cambridge | -- | -- | |
| Secretary Of Housing & Urban | $68,000 | -- | |
| Stack Vanessa D | $57,900 | -- |
Source: Public Records
Mortgage History
| Date | Status | Borrower | Loan Amount |
|---|---|---|---|
| Closed | Stack Vanessa D | -- |
Source: Public Records
Tax History
| Year | Tax Paid | Tax Assessment Tax Assessment Total Assessment is a certain percentage of the fair market value that is determined by local assessors to be the total taxable value of land and additions on the property. | Land | Improvement |
|---|---|---|---|---|
| 2025 | $1,961 | $104,400 | $30,200 | $74,200 |
| 2024 | $1,699 | $98,167 | $0 | $0 |
| 2023 | $1,699 | $91,933 | $0 | $0 |
| 2022 | $3,168 | $85,700 | $30,200 | $55,500 |
| 2021 | $1,475 | $81,967 | $0 | $0 |
| 2020 | $1,475 | $78,233 | $0 | $0 |
| 2019 | $1,420 | $74,500 | $21,100 | $53,400 |
| 2018 | $1,383 | $74,500 | $21,100 | $53,400 |
| 2017 | $1,383 | $74,500 | $0 | $0 |
| 2016 | -- | $77,800 | $0 | $0 |
| 2015 | -- | $77,800 | $0 | $0 |
| 2014 | -- | $77,800 | $0 | $0 |
Source: Public Records
Map
Nearby Homes
- 402 Oakley St
- 0 Edgewood Ave Unit MDDO2010918
- 0 Edgewood Ave Unit MDDO2010930
- 0 Edgewood Ave Unit MDDO2010928
- 0 Edgewood Ave Unit MDDO2010924
- 0 Edgewood Ave Unit MDDO2010926
- 0 Edgewood Ave Unit MDDO2010932
- 409 Oakley St
- 810 Locust St
- 817 Locust St
- 430 Leonards Ln
- 1105 Holland Ave
- 0 Park Ln
- 321 Choptank Ave
- 314 Belvedere Ave
- 307 Willis St
- 709 Church St
- 306 Belvedere Ave
- 521 Edgewood Ave
- 832 Park Ln
Your Personal Tour Guide
Ask me questions while you tour the home.