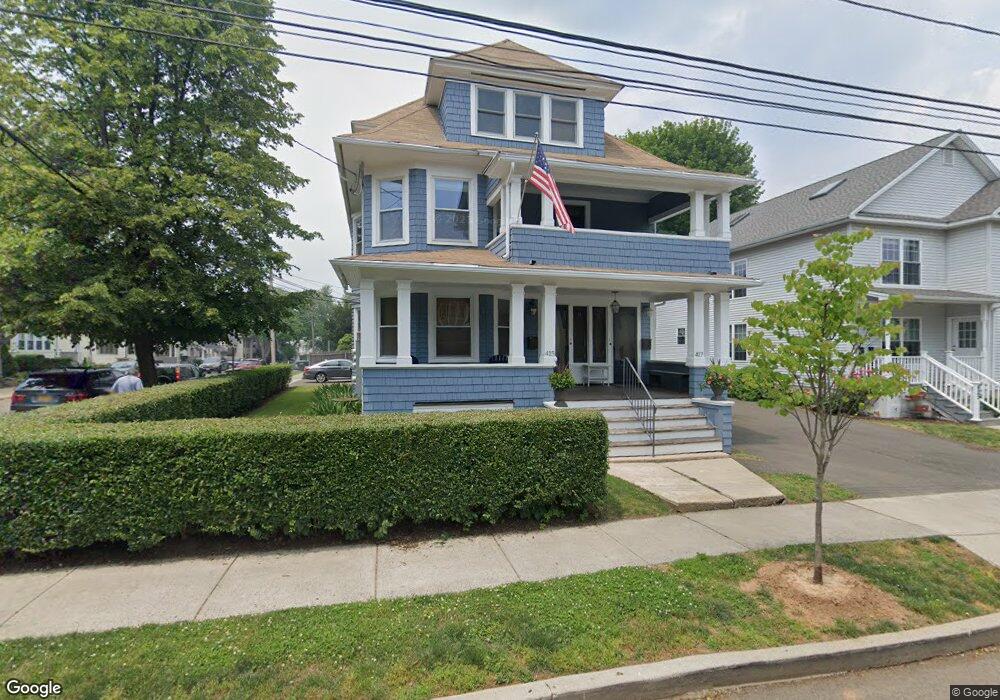
415 Midland St Bridgeport, CT 06605
Black Rock NeighborhoodEstimated Value: $673,311 - $787,000
5
Beds
3
Baths
3,129
Sq Ft
$231/Sq Ft
Est. Value
About This Home
This home is located at 415 Midland St, Bridgeport, CT 06605 and is currently estimated at $723,828, approximately $231 per square foot. 415 Midland St is a home located in Fairfield County with nearby schools including Black Rock School, Bassick High School, and Park City Prep Charter School.
Ownership History
Date
Name
Owned For
Owner Type
Purchase Details
Closed on
Dec 17, 2018
Sold by
Jones Spencer and Jones Marilyn
Bought by
Jones Marilyn and Jones Spencer
Current Estimated Value
Purchase Details
Closed on
Jan 8, 2018
Sold by
Formato Joseph
Bought by
Jones Marilyn and Jones Spencer
Home Financials for this Owner
Home Financials are based on the most recent Mortgage that was taken out on this home.
Original Mortgage
$185,000
Interest Rate
3.92%
Mortgage Type
Unknown
Purchase Details
Closed on
Jul 31, 2007
Sold by
Roach Helen and Sullivan Barbara
Bought by
Quatrella David
Home Financials for this Owner
Home Financials are based on the most recent Mortgage that was taken out on this home.
Original Mortgage
$280,000
Interest Rate
6.78%
Create a Home Valuation Report for This Property
The Home Valuation Report is an in-depth analysis detailing your home's value as well as a comparison with similar homes in the area
Home Values in the Area
Average Home Value in this Area
Purchase History
| Date | Buyer | Sale Price | Title Company |
|---|---|---|---|
| Jones Marilyn | -- | -- | |
| Jones Marilyn | -- | -- | |
| Jones Marilyn | $335,000 | -- | |
| Jones Marilyn | $335,000 | -- | |
| Quatrella David | $100,000 | -- | |
| Formato Joseph | $410,000 | -- | |
| Formato Joseph | $410,000 | -- |
Source: Public Records
Mortgage History
| Date | Status | Borrower | Loan Amount |
|---|---|---|---|
| Previous Owner | Formato Joseph | $185,000 | |
| Previous Owner | Formato Joseph | $280,000 |
Source: Public Records
Tax History Compared to Growth
Tax History
| Year | Tax Paid | Tax Assessment Tax Assessment Total Assessment is a certain percentage of the fair market value that is determined by local assessors to be the total taxable value of land and additions on the property. | Land | Improvement |
|---|---|---|---|---|
| 2025 | $11,168 | $257,020 | $155,820 | $101,200 |
| 2024 | $11,168 | $257,020 | $155,820 | $101,200 |
| 2023 | $11,168 | $257,020 | $155,820 | $101,200 |
| 2022 | $11,168 | $257,020 | $155,820 | $101,200 |
| 2021 | $11,168 | $257,020 | $155,820 | $101,200 |
| 2020 | $10,687 | $197,940 | $114,090 | $83,850 |
| 2019 | $10,687 | $197,940 | $114,090 | $83,850 |
| 2018 | $10,762 | $197,940 | $114,090 | $83,850 |
| 2017 | $10,762 | $197,940 | $114,090 | $83,850 |
| 2016 | $10,762 | $197,940 | $114,090 | $83,850 |
| 2015 | $10,531 | $249,540 | $130,900 | $118,640 |
| 2014 | $10,531 | $249,540 | $130,900 | $118,640 |
Source: Public Records
Map
Nearby Homes
- 39 Jetland Place Unit 41
- 75 Homestead Ave Unit 77
- 554 Brewster St Unit 4
- 105 Fox St Unit 107
- 317 Brewster St
- 20 Haddon St Unit 5
- 26 Rowsley St Unit 3
- 37 Rowsley St Unit 6
- 165 Bennett St
- 855 Brewster St Unit 857
- 166 Alfred St
- 167 Scofield Ave
- 361 Riverside Dr
- 0 Battery Park Dr
- 82 Waldorf Ave
- 135 Whittier St
- 25 Whittier St
- 31 Whittier St
- 2180 Kings Hwy Unit 1
- 122 Colony St
- 427 Midland St
- 425 Midland St
- 435 Midland St Unit 439
- 408 Midland St Unit 410
- 430 Midland St
- 1 Garden Terrace
- 26 Garden Terrace
- 428 Midland St Unit 430
- 438 Midland St Unit 440
- 416 Midland St Unit 420
- 438-440 Midland St
- 447 Midland St
- 36 Garden Terrace Unit 38
- 25 Garden Terrace Unit 29
- 450 Midland St
- 27 Garden Terrace
- 46 Garden Terrace
- 457 Midland St
- 458 Midland St
- 398 Midland St