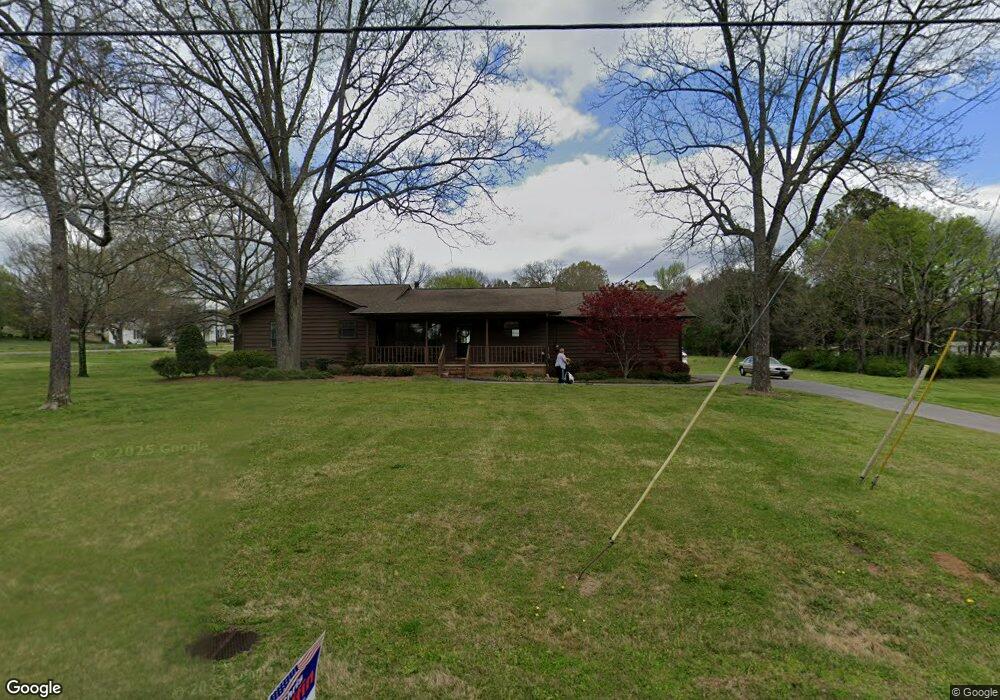
415 Mount View Dr Tunnel Hill, GA 30755
Estimated Value: $253,000 - $289,000
--
Bed
2
Baths
1,800
Sq Ft
$150/Sq Ft
Est. Value
About This Home
This home is located at 415 Mount View Dr, Tunnel Hill, GA 30755 and is currently estimated at $269,330, approximately $149 per square foot. 415 Mount View Dr is a home located in Whitfield County with nearby schools including Tunnel Hill Elementary School, Westside Middle School, and Northwest Whitfield County High School.
Ownership History
Date
Name
Owned For
Owner Type
Purchase Details
Closed on
Jun 20, 2022
Sold by
Putnam Bradley F
Bought by
Putnam Family Trust
Current Estimated Value
Purchase Details
Closed on
Oct 26, 2006
Sold by
Not Provided
Bought by
Putnam Bradley F and Putnam Carole C
Purchase Details
Closed on
Oct 18, 2006
Sold by
Reed James Andrew
Bought by
Voiles Wendy L
Purchase Details
Closed on
Mar 1, 1991
Bought by
Reed James Andrew
Create a Home Valuation Report for This Property
The Home Valuation Report is an in-depth analysis detailing your home's value as well as a comparison with similar homes in the area
Home Values in the Area
Average Home Value in this Area
Purchase History
| Date | Buyer | Sale Price | Title Company |
|---|---|---|---|
| Putnam Family Trust | -- | -- | |
| Putnam Bradley F | $130,000 | -- | |
| Voiles Wendy L | -- | -- | |
| Reed James Andrew | -- | -- |
Source: Public Records
Tax History Compared to Growth
Tax History
| Year | Tax Paid | Tax Assessment Tax Assessment Total Assessment is a certain percentage of the fair market value that is determined by local assessors to be the total taxable value of land and additions on the property. | Land | Improvement |
|---|---|---|---|---|
| 2024 | $529 | $95,842 | $7,400 | $88,442 |
| 2023 | $529 | $69,242 | $7,400 | $61,842 |
| 2022 | $336 | $51,286 | $7,400 | $43,886 |
| 2021 | $336 | $51,286 | $7,400 | $43,886 |
| 2020 | $368 | $51,286 | $7,400 | $43,886 |
| 2019 | $383 | $51,286 | $7,400 | $43,886 |
| 2018 | $399 | $51,286 | $7,400 | $43,886 |
| 2017 | $421 | $51,286 | $7,400 | $43,886 |
| 2016 | $275 | $43,818 | $2,394 | $41,424 |
| 2014 | $192 | $43,818 | $2,394 | $41,424 |
| 2013 | -- | $43,818 | $2,394 | $41,424 |
Source: Public Records
Map
Nearby Homes
- 107 N Varnell Rd
- 203 S Cherry St
- 400 Crawford Terrace
- 0 Mount View Dr Unit 1517505
- 0 Mount View Dr Unit RTC2958565
- 3414 Chattanooga Rd
- 00 Old Chattanooga Rd
- 360 N Lakeshore Dr
- 301 Harper Valley Dr
- Lot 47 Robert Fuller Rd
- Lot 51 Robert Fuller Rd
- Lot 43 Robert Fuller Rd
- Lot 28 Robert Fuller Rd
- Lot 45 Robert Fuller Rd
- Lot 44 Robert Fuller Rd
- 0 Dockwell Unit 1517509
- 0 Dockwell Unit RTC2958569
- 0 Dockwell Unit 1517510
- 0 Dockwell Unit RTC2958570
- Lot 38 Keys Battery Ln
- 112 N Varnell Rd
- 412 Mount View Dr
- 101 N Varnell Rd
- 307 Tunnel Hill Church St
- 419 Mount View Dr
- 114 N Varnell Rd
- 616 Regal Dr
- 113 N Varnell Rd
- 614 Regal Dr
- 100 S Varnell Rd
- 421 Mount View Dr
- 107 S Cherry St
- 610 Regal Dr
- 617 Regal Dr
- 105 S Cherry St
- 103 S Cherry St
- Lot 24 Regal Dr
- 107 S Varnell Rd
- 617 Regal Dr
- 102 S Varnell Rd