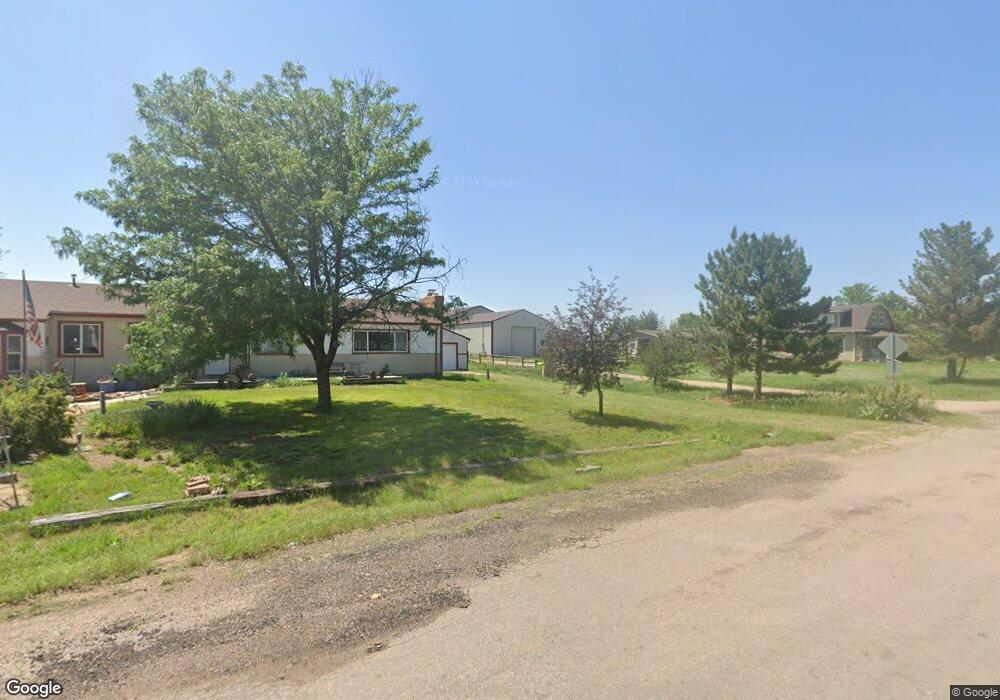
415 N 66th Ave Greeley, CO 80634
Estimated Value: $592,224 - $762,000
3
Beds
3
Baths
2,700
Sq Ft
$252/Sq Ft
Est. Value
About This Home
This home is located at 415 N 66th Ave, Greeley, CO 80634 and is currently estimated at $680,306, approximately $251 per square foot. 415 N 66th Ave is a home located in Weld County with nearby schools including Winograd K-8 Elementary School, Northridge High School, and West Ridge Academy Charter.
Ownership History
Date
Name
Owned For
Owner Type
Purchase Details
Closed on
Nov 4, 2020
Sold by
Keberlein Tom
Bought by
Keberlein Tom
Current Estimated Value
Home Financials for this Owner
Home Financials are based on the most recent Mortgage that was taken out on this home.
Original Mortgage
$990,000
Outstanding Balance
$973,362
Interest Rate
2.83%
Mortgage Type
Reverse Mortgage Home Equity Conversion Mortgage
Estimated Equity
-$293,056
Purchase Details
Closed on
Jun 19, 2020
Sold by
Tom Keberlein Construction Llc
Bought by
Keberlein Tom
Purchase Details
Closed on
Jan 31, 2011
Sold by
Klatt Sandi and Klatt Paul
Bought by
Keberlein Tom
Home Financials for this Owner
Home Financials are based on the most recent Mortgage that was taken out on this home.
Original Mortgage
$235,900
Interest Rate
7%
Mortgage Type
Seller Take Back
Purchase Details
Closed on
Dec 27, 2010
Sold by
The Bank Of New York Mellon
Bought by
Klatt Paul and Klatt Sandi
Home Financials for this Owner
Home Financials are based on the most recent Mortgage that was taken out on this home.
Original Mortgage
$235,900
Interest Rate
7%
Mortgage Type
Seller Take Back
Purchase Details
Closed on
Oct 4, 2010
Sold by
Swanborn Lee R and Swanborn Dawn M
Bought by
The Bank Of New York Mellon
Purchase Details
Closed on
May 27, 2005
Sold by
Rutledge John L and Rutledge Leslie A
Bought by
Swanborn Lee R and Swanborn Dawn M
Home Financials for this Owner
Home Financials are based on the most recent Mortgage that was taken out on this home.
Original Mortgage
$295,200
Interest Rate
5.75%
Mortgage Type
Fannie Mae Freddie Mac
Purchase Details
Closed on
May 17, 2002
Sold by
Rutledge John L
Bought by
Rutledge John L and Rutledge Leslie A
Home Financials for this Owner
Home Financials are based on the most recent Mortgage that was taken out on this home.
Original Mortgage
$260,000
Interest Rate
7.09%
Mortgage Type
Stand Alone First
Purchase Details
Closed on
Apr 18, 2002
Sold by
Rutledge John L and Rutledge Leslie A
Bought by
Rutledge John L
Home Financials for this Owner
Home Financials are based on the most recent Mortgage that was taken out on this home.
Original Mortgage
$260,000
Interest Rate
7.09%
Mortgage Type
Stand Alone First
Purchase Details
Closed on
Mar 30, 2001
Sold by
Gentry Calvin
Bought by
Rutledge John L and Rutledge Leslie A
Home Financials for this Owner
Home Financials are based on the most recent Mortgage that was taken out on this home.
Original Mortgage
$141,700
Interest Rate
6.98%
Purchase Details
Closed on
Mar 20, 1981
Create a Home Valuation Report for This Property
The Home Valuation Report is an in-depth analysis detailing your home's value as well as a comparison with similar homes in the area
Purchase History
| Date | Buyer | Sale Price | Title Company |
|---|---|---|---|
| Keberlein Tom | -- | None Available | |
| Keberlein Tom | -- | None Available | |
| Keberlein Tom | $236,500 | Heritage Title | |
| Klatt Paul | $236,500 | Assured Title | |
| The Bank Of New York Mellon | -- | None Available | |
| Swanborn Lee R | $369,000 | Stewart Title Of Larimer Cou | |
| Rutledge John L | -- | -- | |
| Rutledge John L | -- | -- | |
| Rutledge John L | $218,000 | -- | |
| -- | -- | -- |
Source: Public Records
Mortgage History
| Date | Status | Borrower | Loan Amount |
|---|---|---|---|
| Open | Mcnamee Nancy | $990,000 | |
| Previous Owner | Keberlein Tom | $235,900 | |
| Previous Owner | Swanborn Lee R | $295,200 | |
| Previous Owner | Rutledge John L | $260,000 | |
| Previous Owner | Rutledge John L | $141,700 |
Source: Public Records
Tax History
| Year | Tax Paid | Tax Assessment Tax Assessment Total Assessment is a certain percentage of the fair market value that is determined by local assessors to be the total taxable value of land and additions on the property. | Land | Improvement |
|---|---|---|---|---|
| 2025 | $2,089 | $37,340 | $10,520 | $26,820 |
| 2024 | $2,089 | $37,340 | $10,520 | $26,820 |
| 2023 | $1,896 | $35,590 | $10,010 | $25,580 |
| 2022 | $1,805 | $28,900 | $9,260 | $19,640 |
| 2021 | $2,577 | $29,730 | $9,530 | $20,200 |
| 2020 | $2,386 | $27,810 | $9,330 | $18,480 |
| 2019 | $2,409 | $27,810 | $9,330 | $18,480 |
| 2018 | $2,373 | $28,920 | $7,780 | $21,140 |
| 2017 | $2,386 | $28,920 | $7,780 | $21,140 |
| 2016 | $2,042 | $27,880 | $6,720 | $21,160 |
| 2015 | $2,041 | $27,880 | $6,720 | $21,160 |
| 2014 | $1,263 | $16,890 | $6,240 | $10,650 |
Source: Public Records
Map
Nearby Homes
- 408 N 67th Ave
- 333 N 64th Ave
- 317 N 64th Ave
- 117 N 66th Ave
- 305 N 64th Ave
- 107 65th Ave
- 118 65th Ave
- 121 63rd Ave
- 6119 B St
- 6120 B St
- 135 65th Ave
- 6309 2nd St
- 6122 1st St
- 6101 1st St
- 6302 2nd St
- 7204 Vallevue Dr
- 419 N Brisbane Ave
- 6603 W 3rd St Unit 1620
- 6608 W 3rd St Unit 32-61
- 6911 W 3rd St Unit 920
- 501 N 66th Ave
- 410 N 66th Ave
- 403 N 66th Ave
- 502 N 66th Ave
- 400 N 66th Ave
- 445 N 66th Ave
- 512 N 66th Ave
- 510 N 67th Ave
- 341 66th Ave
- 595 N 66th Ave
- 592 N 66th Ave
- 6413 B Street Rd
- 6615 W C St
- 6409 B Street Rd
- 337 N 66th Ave
- 6405 B Street Rd
- 333 N 66th Ave
- 6401 B Street Rd
- 332 N 66th Ave
- 596 N 66th Ave
Your Personal Tour Guide
Ask me questions while you tour the home.