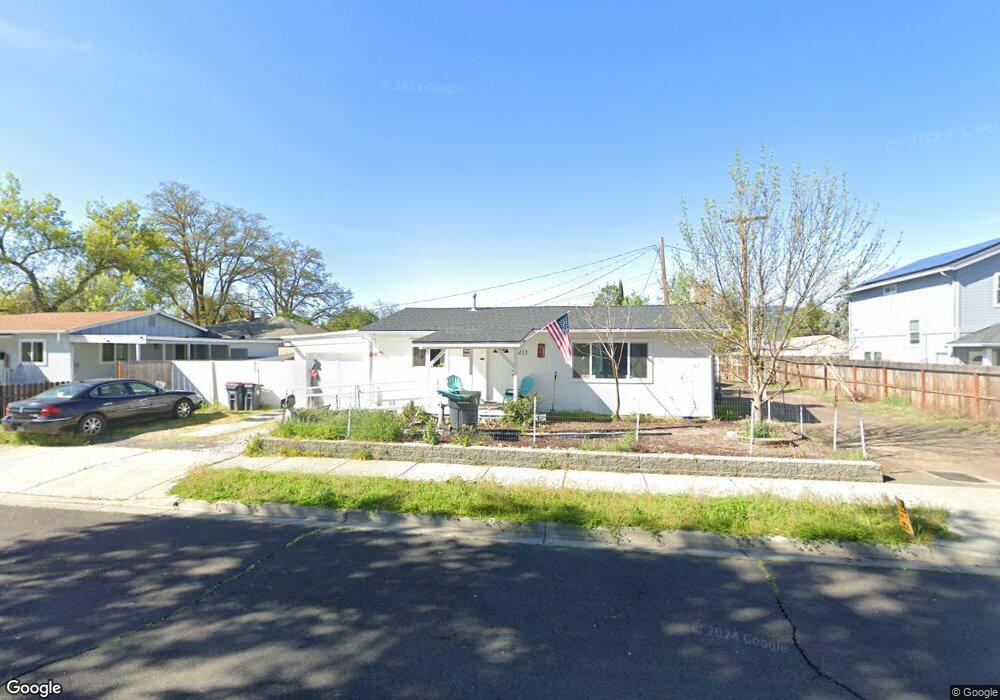
415 N 9th St Central Point, OR 97502
Estimated Value: $257,000 - $443,786
2
Beds
1
Bath
864
Sq Ft
$362/Sq Ft
Est. Value
About This Home
This home is located at 415 N 9th St, Central Point, OR 97502 and is currently estimated at $312,947, approximately $362 per square foot. 415 N 9th St is a home located in Jackson County with nearby schools including Jewett Elementary School, Scenic Middle School, and Crater High School.
Ownership History
Date
Name
Owned For
Owner Type
Purchase Details
Closed on
Dec 7, 2023
Sold by
Dorr G R
Bought by
Dorr Gene R
Current Estimated Value
Home Financials for this Owner
Home Financials are based on the most recent Mortgage that was taken out on this home.
Original Mortgage
$266,988
Outstanding Balance
$262,797
Interest Rate
7.79%
Mortgage Type
VA
Estimated Equity
$50,150
Purchase Details
Closed on
Sep 19, 2005
Sold by
Valverde Dennis D and Valverde Yolanda B
Bought by
Dorr G R
Purchase Details
Closed on
Dec 15, 2003
Sold by
Williams Nancy
Bought by
Valverde Dennis D and Valverde Yolanda B
Create a Home Valuation Report for This Property
The Home Valuation Report is an in-depth analysis detailing your home's value as well as a comparison with similar homes in the area
Home Values in the Area
Average Home Value in this Area
Purchase History
| Date | Buyer | Sale Price | Title Company |
|---|---|---|---|
| Dorr Gene R | -- | First American Title | |
| Dorr G R | $150,000 | Ticor Title | |
| Valverde Dennis D | $38,820 | First American |
Source: Public Records
Mortgage History
| Date | Status | Borrower | Loan Amount |
|---|---|---|---|
| Open | Dorr Gene R | $266,988 |
Source: Public Records
Tax History Compared to Growth
Tax History
| Year | Tax Paid | Tax Assessment Tax Assessment Total Assessment is a certain percentage of the fair market value that is determined by local assessors to be the total taxable value of land and additions on the property. | Land | Improvement |
|---|---|---|---|---|
| 2025 | $1,127 | $99,320 | $40,240 | $59,080 |
| 2024 | $1,127 | $96,430 | $39,070 | $57,360 |
| 2023 | $1,356 | $93,630 | $37,940 | $55,690 |
| 2022 | $1,065 | $93,630 | $37,940 | $55,690 |
| 2021 | $1,035 | $90,910 | $36,840 | $54,070 |
| 2020 | $1,005 | $88,270 | $35,770 | $52,500 |
| 2019 | $980 | $83,210 | $33,720 | $49,490 |
| 2018 | $950 | $80,790 | $32,740 | $48,050 |
| 2017 | $926 | $80,790 | $32,740 | $48,050 |
| 2016 | $899 | $76,160 | $30,850 | $45,310 |
| 2015 | $862 | $76,160 | $30,850 | $45,310 |
| 2014 | $840 | $71,800 | $29,070 | $42,730 |
Source: Public Records
Map
Nearby Homes