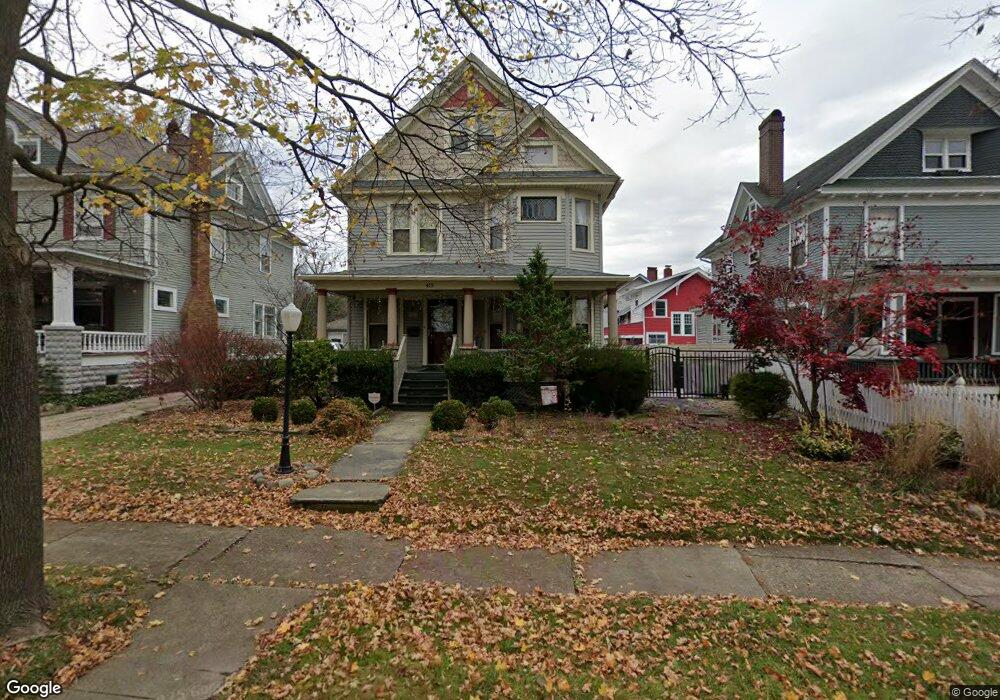
415 N Bever St Wooster, OH 44691
Estimated Value: $197,000 - $208,091
3
Beds
3
Baths
1,826
Sq Ft
$112/Sq Ft
Est. Value
About This Home
This home is located at 415 N Bever St, Wooster, OH 44691 and is currently estimated at $204,773, approximately $112 per square foot. 415 N Bever St is a home located in Wayne County with nearby schools including Cornerstone Elementary School, Edgewood Middle School, and Wooster High School.
Ownership History
Date
Name
Owned For
Owner Type
Purchase Details
Closed on
Jun 24, 1999
Sold by
Mclain Scott A
Bought by
Beno Susan S and Beno John
Current Estimated Value
Home Financials for this Owner
Home Financials are based on the most recent Mortgage that was taken out on this home.
Original Mortgage
$84,800
Interest Rate
7.15%
Mortgage Type
New Conventional
Purchase Details
Closed on
Jul 11, 1994
Sold by
Hildebrand Robert I
Bought by
Mclain Scott A and Mclain Theresia
Home Financials for this Owner
Home Financials are based on the most recent Mortgage that was taken out on this home.
Original Mortgage
$99,000
Interest Rate
8.61%
Mortgage Type
New Conventional
Purchase Details
Closed on
Apr 13, 1993
Sold by
Hildebrand Robert I and Hildebrand Eth
Bought by
Hildebrand Robert I and Hildebrand Eth
Purchase Details
Closed on
Nov 28, 1988
Sold by
Emerson Fritz
Bought by
Hildebrand Robert I and Hildebrand Eth
Create a Home Valuation Report for This Property
The Home Valuation Report is an in-depth analysis detailing your home's value as well as a comparison with similar homes in the area
Home Values in the Area
Average Home Value in this Area
Purchase History
| Date | Buyer | Sale Price | Title Company |
|---|---|---|---|
| Beno Susan S | $106,000 | -- | |
| Mclain Scott A | $110,000 | -- | |
| Hildebrand Robert I | -- | -- | |
| Hildebrand Robert I | $64,000 | -- |
Source: Public Records
Mortgage History
| Date | Status | Borrower | Loan Amount |
|---|---|---|---|
| Previous Owner | Beno Susan S | $84,800 | |
| Previous Owner | Mclain Scott A | $99,000 |
Source: Public Records
Tax History Compared to Growth
Tax History
| Year | Tax Paid | Tax Assessment Tax Assessment Total Assessment is a certain percentage of the fair market value that is determined by local assessors to be the total taxable value of land and additions on the property. | Land | Improvement |
|---|---|---|---|---|
| 2024 | $2,176 | $61,960 | $11,930 | $50,030 |
| 2023 | $2,176 | $61,960 | $11,930 | $50,030 |
| 2022 | $1,839 | $43,940 | $8,460 | $35,480 |
| 2021 | $1,897 | $43,940 | $8,460 | $35,480 |
| 2020 | $1,799 | $43,940 | $8,460 | $35,480 |
| 2019 | $1,436 | $35,690 | $9,770 | $25,920 |
| 2018 | $1,440 | $35,690 | $9,770 | $25,920 |
| 2017 | $1,440 | $35,690 | $9,770 | $25,920 |
| 2016 | $1,476 | $34,320 | $9,400 | $24,920 |
| 2015 | $1,449 | $34,320 | $9,400 | $24,920 |
| 2014 | $1,450 | $34,320 | $9,400 | $24,920 |
| 2013 | $1,723 | $38,810 | $9,200 | $29,610 |
Source: Public Records
Map
Nearby Homes
- 331 Derr Ave
- 223 E Larwill St
- 423 N Market St
- 534 N Buckeye St
- 657 N Bever St
- 227 N Walnut St
- 708 N Bever St
- 537 N Grant St
- 548 Spring St
- 814 N Bever St
- 331 Lawn St
- 606 E Henry St
- 1117 Quinby Ave
- 140 Ohio St
- 5 E Melrose Unit 5
- 758 Western Dr
- 801 & 803 Colony Ct
- 585 Kieffer St
- 1587 Saunders Dr
- 1575 Bellevue Dr