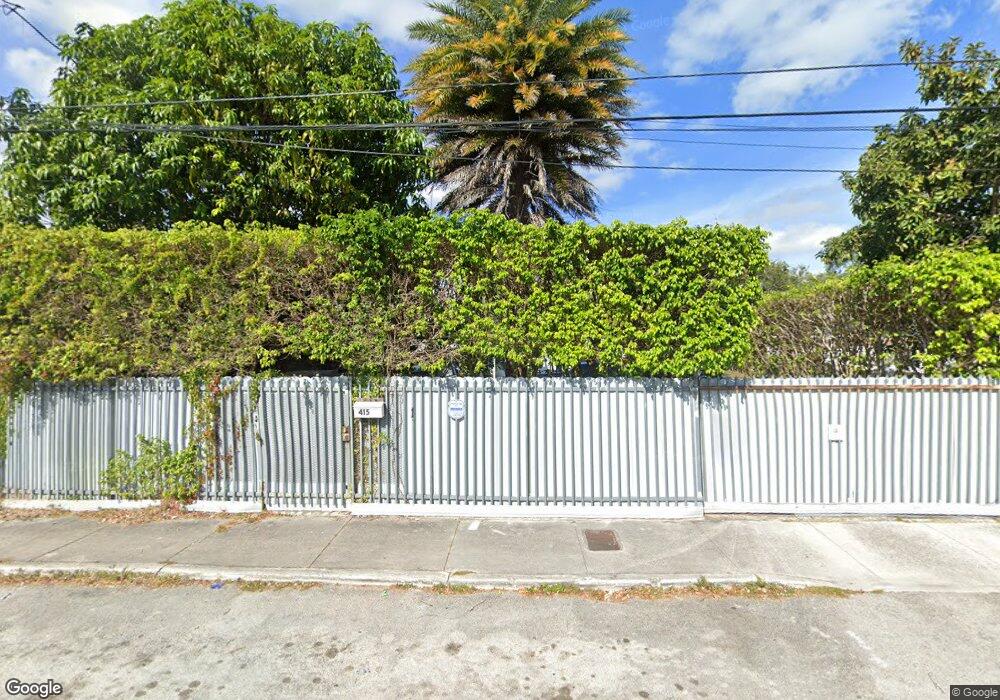
415 NW 50th St Miami, FL 33127
Little Haiti NeighborhoodEstimated Value: $647,000 - $1,102,000
3
Beds
1
Bath
696
Sq Ft
$1,234/Sq Ft
Est. Value
About This Home
This home is located at 415 NW 50th St, Miami, FL 33127 and is currently estimated at $858,536, approximately $1,233 per square foot. 415 NW 50th St is a home located in Miami-Dade County with nearby schools including Shadow Lawn Elementary School, Jose De Diego Middle School, and Miami Edison Senior High School.
Ownership History
Date
Name
Owned For
Owner Type
Purchase Details
Closed on
Sep 22, 2015
Sold by
Kemp Constance
Bought by
Merk Paul
Current Estimated Value
Purchase Details
Closed on
Jun 23, 2009
Sold by
A C G Investments Llc
Bought by
Kemp Constance and Dean Kevin
Home Financials for this Owner
Home Financials are based on the most recent Mortgage that was taken out on this home.
Original Mortgage
$95,000
Interest Rate
4.79%
Mortgage Type
Unknown
Purchase Details
Closed on
Oct 16, 2007
Sold by
Jam Investment Inc
Bought by
A C G Investments Llc
Purchase Details
Closed on
Aug 20, 2002
Sold by
Speedy Interiors Inc C
Bought by
Jam Investment Inc
Purchase Details
Closed on
Aug 1, 2002
Sold by
Speedy Interior Inc C
Bought by
Jam Investment Inc
Purchase Details
Closed on
Feb 15, 2002
Sold by
Homes Amira I
Bought by
Speedy Interiors
Purchase Details
Closed on
Jun 20, 2001
Sold by
Bobby Allen I
Bought by
Amira Homes
Create a Home Valuation Report for This Property
The Home Valuation Report is an in-depth analysis detailing your home's value as well as a comparison with similar homes in the area
Home Values in the Area
Average Home Value in this Area
Purchase History
| Date | Buyer | Sale Price | Title Company |
|---|---|---|---|
| Merk Paul | $78,000 | Adams Cameron Title Svcs Inc | |
| Merk Paul | $78,000 | Adams Cameron Title Svcs Inc | |
| Kemp Constance | $100,000 | Attorney | |
| A C G Investments Llc | $115,000 | Attorney | |
| Jam Investment Inc | -- | -- | |
| Jam Investment Inc | $10,000 | -- | |
| Speedy Interiors | $50,000 | -- | |
| Amira Homes | $13,000 | -- |
Source: Public Records
Mortgage History
| Date | Status | Borrower | Loan Amount |
|---|---|---|---|
| Previous Owner | Kemp Constance | $95,000 |
Source: Public Records
Tax History
| Year | Tax Paid | Tax Assessment Tax Assessment Total Assessment is a certain percentage of the fair market value that is determined by local assessors to be the total taxable value of land and additions on the property. | Land | Improvement |
|---|---|---|---|---|
| 2025 | $12,156 | $584,179 | -- | -- |
| 2024 | $11,461 | $531,072 | -- | -- |
| 2023 | $11,461 | $482,793 | $0 | $0 |
| 2022 | $10,014 | $438,903 | $0 | $0 |
| 2021 | $8,857 | $399,003 | $201,453 | $197,550 |
| 2020 | $8,380 | $380,721 | $187,362 | $193,359 |
| 2019 | $7,619 | $339,127 | $144,044 | $195,083 |
| 2018 | $6,973 | $314,756 | $117,949 | $196,807 |
| 2017 | $6,552 | $287,449 | $0 | $0 |
| 2016 | $6,083 | $261,318 | $0 | $0 |
| 2015 | $2,376 | $131,205 | $0 | $0 |
| 2014 | $2,397 | $130,164 | $0 | $0 |
Source: Public Records
Map
Nearby Homes
- 355 NW 50th St
- 5037 NW 5th Ave
- 4945 NW 5th Ave
- 5116 NW 3rd Ave
- 280 NW 51st St
- 408 NW 52nd St
- 337 NW 48th St
- 5130 NW 5th Ave
- 5130 - 5140 NW 5th Ave
- 5140 NW 5th Ave
- 547 NW 49th St
- 535 NW 52nd St
- 281 NW 52nd St
- 223 NW 51st St
- 5210 NW 5th Ave
- 5010 NW 2nd Ave
- 424 NW 53rd St
- 575 NW 49th St
- 290 NW 48th St
- 536 NW 48th St
- 411 NW 50th St
- 421 NW 50th St
- 361 NW 50th St
- 5019 NW 5th Ave
- 5025 NW 5th Ave
- 5001 NW 5th Ave
- 422 NW 51st St Unit 2
- 420 NW 51st St Unit 420
- 420 NW 51st St
- 420 NW 51st St Unit 422
- 359 NW 50th St
- 5039 NW 5th Ave
- 5019 NW 5 Ave
- 5035 NW 5 Ave
- 5035 NW 5th Ave Unit 5035
- 5023 NW 5th Ave
- 4995 NW 5th Ave
- 4995 NW 5th Ave Unit 4997
- 4995 NW 5th Ave
- 4997 NW 5th Ave
Your Personal Tour Guide
Ask me questions while you tour the home.