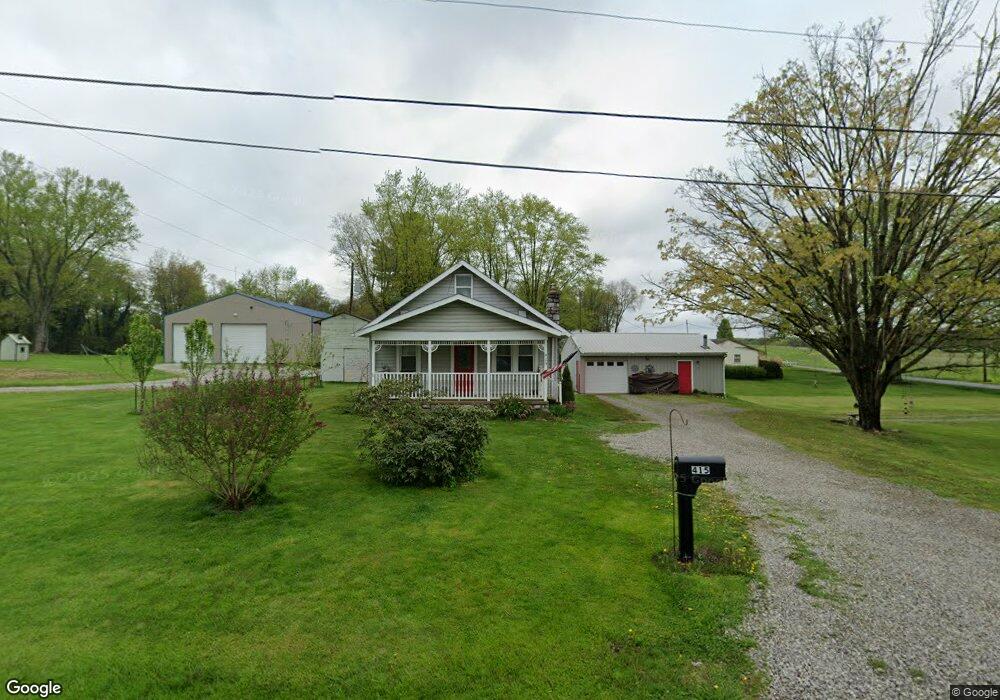
415 Obannon Ave Newark, OH 43055
Estimated Value: $195,000 - $219,542
3
Beds
1
Bath
1,139
Sq Ft
$179/Sq Ft
Est. Value
About This Home
This home is located at 415 Obannon Ave, Newark, OH 43055 and is currently estimated at $203,886, approximately $179 per square foot. 415 Obannon Ave is a home located in Licking County with nearby schools including Carson Elementary School, Heritage Middle School, and Newark High School.
Ownership History
Date
Name
Owned For
Owner Type
Purchase Details
Closed on
Oct 31, 2019
Sold by
Cardington Apartments Llc
Bought by
Keeley Ronald A and Keeley Jenny L
Current Estimated Value
Home Financials for this Owner
Home Financials are based on the most recent Mortgage that was taken out on this home.
Original Mortgage
$133,257
Outstanding Balance
$117,232
Interest Rate
3.6%
Mortgage Type
VA
Estimated Equity
$86,654
Purchase Details
Closed on
Sep 18, 2004
Sold by
Sensabaugh Dorothy M
Bought by
Myers Brandon L and Myers Leah M
Home Financials for this Owner
Home Financials are based on the most recent Mortgage that was taken out on this home.
Original Mortgage
$87,900
Interest Rate
5.95%
Mortgage Type
Unknown
Purchase Details
Closed on
Oct 2, 2002
Sold by
Harrold Todd A
Bought by
Sensabaugh Dorothy M
Create a Home Valuation Report for This Property
The Home Valuation Report is an in-depth analysis detailing your home's value as well as a comparison with similar homes in the area
Home Values in the Area
Average Home Value in this Area
Purchase History
| Date | Buyer | Sale Price | Title Company |
|---|---|---|---|
| Keeley Ronald A | $129,000 | None Available | |
| Myers Brandon L | $97,900 | Chelsea Title Agency | |
| Sensabaugh Dorothy M | $93,000 | -- |
Source: Public Records
Mortgage History
| Date | Status | Borrower | Loan Amount |
|---|---|---|---|
| Open | Keeley Ronald A | $133,257 | |
| Previous Owner | Myers Brandon L | $87,900 |
Source: Public Records
Tax History Compared to Growth
Tax History
| Year | Tax Paid | Tax Assessment Tax Assessment Total Assessment is a certain percentage of the fair market value that is determined by local assessors to be the total taxable value of land and additions on the property. | Land | Improvement |
|---|---|---|---|---|
| 2024 | $1,834 | $53,800 | $13,370 | $40,430 |
| 2023 | $1,858 | $53,800 | $13,370 | $40,430 |
| 2022 | $2,080 | $43,760 | $8,510 | $35,250 |
| 2021 | $2,167 | $43,760 | $8,510 | $35,250 |
| 2020 | $2,208 | $43,760 | $8,510 | $35,250 |
| 2019 | $1,725 | $33,850 | $7,740 | $26,110 |
| 2018 | $1,735 | $0 | $0 | $0 |
| 2017 | $1,669 | $0 | $0 | $0 |
| 2016 | $1,771 | $0 | $0 | $0 |
| 2015 | $1,805 | $0 | $0 | $0 |
| 2014 | $2,303 | $0 | $0 | $0 |
| 2013 | $1,726 | $0 | $0 | $0 |
Source: Public Records
Map
Nearby Homes
- 934 Garfield Ave
- 554 Garfield Ave
- 506 Lexington Ave
- 483 Allston Ave
- 87 Liberty Ave
- 688 Russell Ave
- 460 Allston Ave
- 952 Emerson St
- 491 Garfield Ave
- 240 N Wing St
- 424 Ridge Ave
- 167 Essex St
- 76 Oakwood Ave
- 160 N Cedar St
- 408 Cedarcrest Ave
- 232 Rosehill Ave
- 430 E Main St
- 204 Hunter St
- 136 Hunter St
- 284 Everett Ave
- 415 O'Bannon Ave
- 751 New Haven Ave
- 371 Obannon Ave
- 9293 Butler Rd
- 741 New Haven Ave
- 731 New Haven Ave
- 9324 Butler Rd
- 721 New Haven Ave
- 711 New Haven Ave
- 360 Obannon Ave
- 9348 Butler Rd
- 301 Obannon Ave
- 368 Montgomery Ave
- 306 Obannon Ave
- 9386 Butler Rd
- 345 Belle Vista Ave
- 360 Montgomery Ave
- 337 Belle Vista Ave
- 301 Belle Vista Ave
- 667 New Haven Ave