
415 Pinoak Ln Cypress, IL 62923
Estimated payment $4,417/month
Total Views
26,459
5
Beds
2
Baths
1,700
Sq Ft
$435
Price per Sq Ft
About This Home
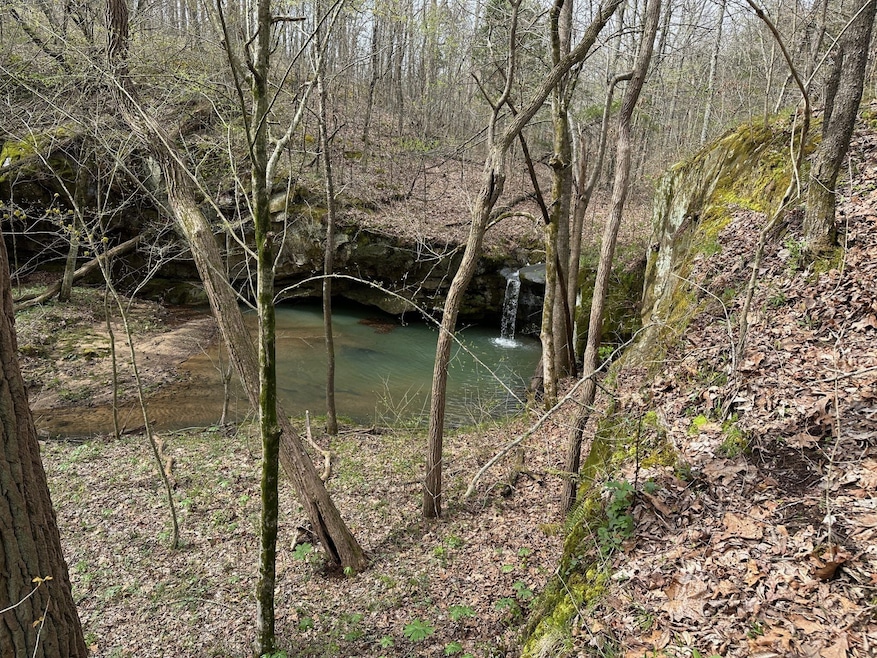
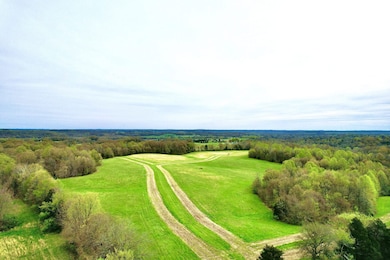
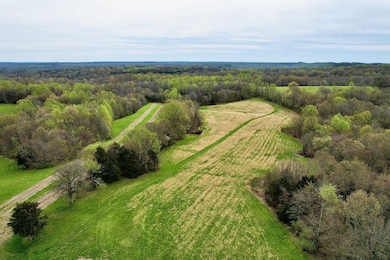
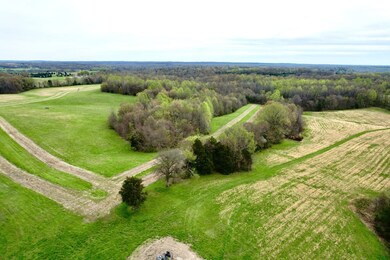
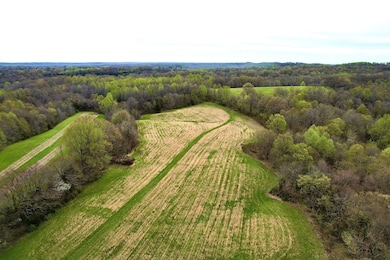
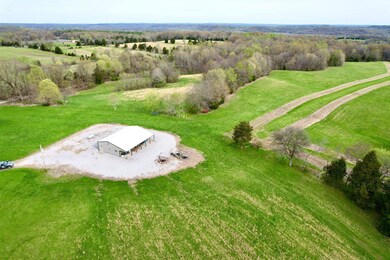
Hunters Paradise! This 150 acre mostly wooded farm is set up and ready to go! You can start with the 5 bedroom, 2 bath, cabin with dining area and full kitchen that sits high on the hill and overlooks the entire farm. You can tell stories around the fire and prepare for the hunt while enjoying the comforts of home! The land is made up of rolling hills, hardwoods, established food plots and a trail system that makes getting to your favorite stand easy! There is also income from Hay and CRP and a smaller barn for tractors and equipment! This one is as turn-key a hunting farm as they come. Call us today for a private showing.
Hay and CRP Income
trails
stands
food plots
Barn
Listing Provided By

Home Details
Home Type
- Single Family
Est. Annual Taxes
- $4,014
Lot Details
- Current uses include hunting/fishing
Bedrooms and Bathrooms
- 5 Bedrooms
- 2 Full Bathrooms
Map
Create a Home Valuation Report for This Property
The Home Valuation Report is an in-depth analysis detailing your home's value as well as a comparison with similar homes in the area
Home Values in the Area
Average Home Value in this Area
Tax History
| Year | Tax Paid | Tax Assessment Tax Assessment Total Assessment is a certain percentage of the fair market value that is determined by local assessors to be the total taxable value of land and additions on the property. | Land | Improvement |
|---|---|---|---|---|
| 2024 | $4,014 | $60,377 | $22,541 | $37,836 |
| 2023 | $3,160 | $44,494 | $19,382 | $25,112 |
| 2022 | $3,041 | $41,809 | $16,697 | $25,112 |
| 2021 | $2,943 | $39,381 | $14,269 | $25,112 |
| 2020 | $2,750 | $37,146 | $12,034 | $25,112 |
| 2019 | $2,681 | $34,512 | $9,600 | $24,912 |
| 2018 | $2,570 | $32,712 | $7,800 | $24,912 |
| 2017 | $248 | $31,032 | $6,120 | $24,912 |
| 2016 | $2,416 | $29,877 | $4,965 | $24,912 |
| 2015 | $2,153 | $26,097 | $5,610 | $20,487 |
| 2014 | $1,978 | $25,407 | $4,920 | $20,487 |
| 2013 | $2,015 | $25,322 | $4,835 | $20,487 |
| 2012 | $1,794 | $23,247 | $0 | $0 |
Source: Public Records
Property History
| Date | Event | Price | Change | Sq Ft Price |
|---|---|---|---|---|
| 05/07/2025 05/07/25 | For Sale | $739,000 | 0.0% | $435 / Sq Ft |
| 03/18/2025 03/18/25 | Off Market | $739,000 | -- | -- |
| 03/18/2025 03/18/25 | Price Changed | $739,000 | -1.5% | $435 / Sq Ft |
| 10/07/2024 10/07/24 | For Sale | $749,900 | 0.0% | $441 / Sq Ft |
| 10/07/2024 10/07/24 | Price Changed | $749,900 | 0.0% | $441 / Sq Ft |
| 04/04/2024 04/04/24 | Off Market | $750,000 | -- | -- |
| 04/04/2024 04/04/24 | Price Changed | $750,000 | -3.8% | $441 / Sq Ft |
| 04/04/2024 04/04/24 | For Sale | $780,000 | 0.0% | $459 / Sq Ft |
| 03/31/2024 03/31/24 | Off Market | $780,000 | -- | -- |
| 04/10/2023 04/10/23 | For Sale | $780,000 | -- | $459 / Sq Ft |
Purchase History
| Date | Type | Sale Price | Title Company |
|---|---|---|---|
| Deed | $100,000 | -- |
Source: Public Records
Nearby Homes
- 313 Double C Farm Ln
- 5960 W Eden Rd
- 5825 Moscow Rd
- 000 Annabell Rd Unit Lot WP001
- 507 N 11th St
- 200 Weaver Ln
- 8305 Illinois 146
- 110 Cox Ln
- 001 U S Highway 51
- TBD E 1st St
- 7725 U S 51
- 8027 Shawnee College Rd
- 203 E Main St
- 001 Main St
- 2560 Old Route 146 Loop
- 339 Spring St
- 211 Spring St
- 210 SE Front St
- 1408 Illinois 169
- 1860 Mount Zion Rd
- 75 Walton Ln Unit A
- 6113 Giant City Rd
- 500 Saluki Blvd
- 1207 S Wall St
- 1205 E Grand Ave
- 1101 E Grand Ave
- 600 E Campus Dr Unit 8A
- 805 E Park St
- 1200 E Grand Ave
- 900 E Park St
- 607 E Park St
- 614 E Park St
- 1000 E Grand Ave
- 900 E Grand Ave
- 800 E Grand Ave
- 1004 W Main St Unit SUITE
- 8230 Old Cairo Rd
- 250 S Lewis Ln
- 511 S Graham Ave
- 1195 E Walnut St