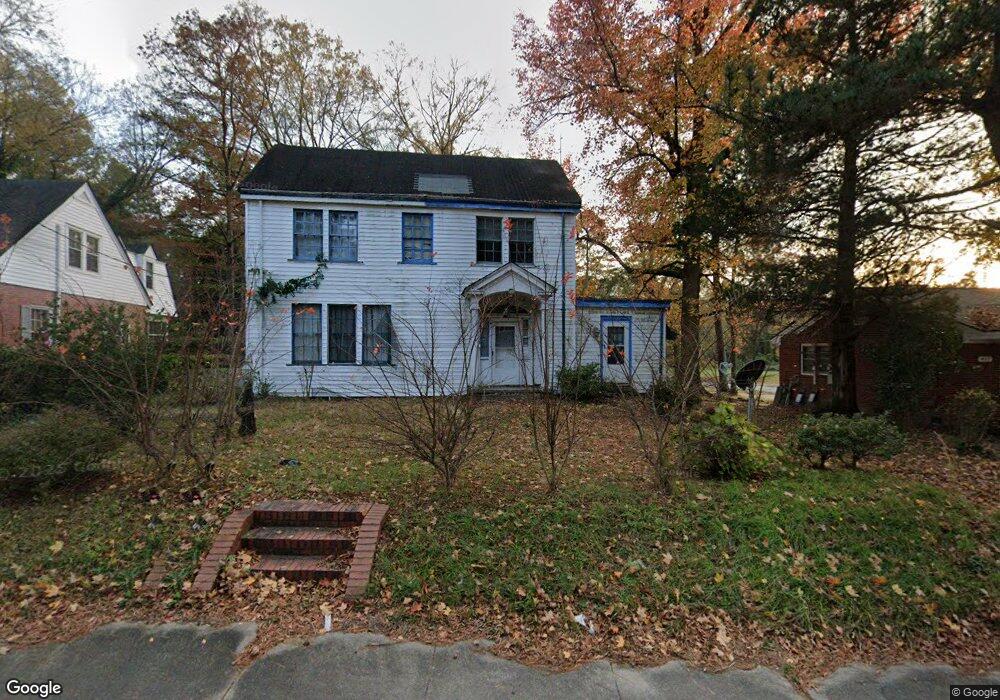
415 Raleigh Road Pkwy W Wilson, NC 27893
Estimated Value: $184,348 - $264,000
3
Beds
2
Baths
2,100
Sq Ft
$110/Sq Ft
Est. Value
About This Home
This home is located at 415 Raleigh Road Pkwy W, Wilson, NC 27893 and is currently estimated at $230,587, approximately $109 per square foot. 415 Raleigh Road Pkwy W is a home located in Wilson County with nearby schools including Margaret Hearne Elementary School, James Hunt High School, and Forest Hills Middle School.
Ownership History
Date
Name
Owned For
Owner Type
Purchase Details
Closed on
Jun 16, 2023
Sold by
Title Holding Trust
Bought by
Equity Trust Co and Hoffman Lawrence J
Current Estimated Value
Purchase Details
Closed on
Mar 29, 2023
Sold by
Birch Grove Holdings Llc
Bought by
Title Holding Trust
Purchase Details
Closed on
Mar 16, 2016
Sold by
Colonial Impact Fund Ii Llc
Bought by
Birch Grove Holdings Llc
Purchase Details
Closed on
Oct 29, 2015
Sold by
Capital Income & Growth Fund Llc
Bought by
Colonial Impact Fund Ii Llc
Purchase Details
Closed on
Jul 10, 2013
Sold by
Springleaf Financial Services Of North C
Bought by
Capital Income And Growth Fund Llc
Purchase Details
Closed on
Feb 21, 2012
Sold by
Nelson Annie Ruth and Nelson Harry Louis
Bought by
Springleaf Financial Services Of North C
Create a Home Valuation Report for This Property
The Home Valuation Report is an in-depth analysis detailing your home's value as well as a comparison with similar homes in the area
Home Values in the Area
Average Home Value in this Area
Purchase History
| Date | Buyer | Sale Price | Title Company |
|---|---|---|---|
| Equity Trust Co | $13,056 | None Listed On Document | |
| Title Holding Trust | $11,200 | None Listed On Document | |
| Birch Grove Holdings Llc | $24,500 | None Available | |
| Colonial Impact Fund Ii Llc | $17,500 | Attorney | |
| Capital Income And Growth Fund Llc | $8,000 | Cosmopolitan Title Agency L | |
| Springleaf Financial Services Of North C | $25,000 | None Available |
Source: Public Records
Tax History Compared to Growth
Tax History
| Year | Tax Paid | Tax Assessment Tax Assessment Total Assessment is a certain percentage of the fair market value that is determined by local assessors to be the total taxable value of land and additions on the property. | Land | Improvement |
|---|---|---|---|---|
| 2025 | $1,571 | $140,278 | $31,500 | $108,778 |
| 2024 | $1,571 | $140,278 | $31,500 | $108,778 |
| 2023 | $1,117 | $85,626 | $10,800 | $74,826 |
| 2022 | $1,117 | $85,626 | $10,800 | $74,826 |
| 2021 | $1,117 | $85,626 | $10,800 | $74,826 |
| 2020 | $1,117 | $85,626 | $10,800 | $74,826 |
| 2019 | $1,117 | $85,626 | $10,800 | $74,826 |
| 2018 | $0 | $85,626 | $10,800 | $74,826 |
| 2017 | $1,100 | $85,626 | $10,800 | $74,826 |
| 2016 | $1,122 | $85,626 | $10,800 | $74,826 |
| 2014 | $1,213 | $97,467 | $10,800 | $86,667 |
Source: Public Records
Map
Nearby Homes
- 1009 Walnut St W
- 310 Atlantic Christian College Dr W
- 416 Rountree St W
- 1103 Kenan St NW
- 1003 Branch St NW
- 1005 Anderson St NW
- 711 Kenan St W
- 703 Broad St W
- 905 Nash St NW
- 701 Franklin Ave W
- 700 Kenan St W
- 403 Kincaid Ave NW
- 900 Nash St N
- 207 Bruton St W
- 1305 Kenan St NW
- 209 Daniel St W
- 1305 Anderson St NW
- 506 Kenan St W
- 806 Vance St N
- 1121 Vance St N
- 415 S Raleigh Pkwy
- 413 Raleigh Road Pkwy W
- 1104 Walnut St W
- 411 Raleigh Road Pkwy W
- 1102 Walnut St W
- 409 Raleigh Road Pkwy W
- 501 Raleigh Road Pkwy W
- 501 Raleigh Road Pkwy W Unit Y
- 422 Westover Ave W
- 410 Raleigh Road Pkwy W
- 420 Westover Ave W
- 1100 Sunset Crescent NW
- 424 Westover Ave W
- 418 Westover Ave W
- 1101 Walnut St W
- 419 Westover Ave W
- 421 Westover Ave W
- 405 Westover Ave W
- 1118 Sunset Crescent NW
- 417 Sunset Rd NW