415 S 1800 E Kaysville, UT 84037
Estimated Value: $724,000 - $998,000
5
Beds
4
Baths
3,886
Sq Ft
$212/Sq Ft
Est. Value
About This Home
This home is located at 415 S 1800 E, Kaysville, UT 84037 and is currently estimated at $825,741, approximately $212 per square foot. 415 S 1800 E is a home located in Davis County with nearby schools including Morgan Elementary School, Fairfield Junior High School, and Davis High School.
Ownership History
Date
Name
Owned For
Owner Type
Purchase Details
Closed on
Mar 26, 2024
Sold by
Soutor Todd and Soutor Danielle
Bought by
Soutor Family Revocable Living Trust and Soutor
Current Estimated Value
Purchase Details
Closed on
Nov 30, 2009
Sold by
Jones Kyle and Jones Sydney
Bought by
Soutor Todd and Soutor Danielle
Home Financials for this Owner
Home Financials are based on the most recent Mortgage that was taken out on this home.
Original Mortgage
$260,000
Interest Rate
4.99%
Mortgage Type
New Conventional
Purchase Details
Closed on
Jun 16, 1999
Sold by
Beagley David and Beagley Bonnie
Bought by
Jones Kyle and Jones Sydney
Home Financials for this Owner
Home Financials are based on the most recent Mortgage that was taken out on this home.
Original Mortgage
$152,000
Interest Rate
6.37%
Create a Home Valuation Report for This Property
The Home Valuation Report is an in-depth analysis detailing your home's value as well as a comparison with similar homes in the area
Home Values in the Area
Average Home Value in this Area
Purchase History
| Date | Buyer | Sale Price | Title Company |
|---|---|---|---|
| Soutor Family Revocable Living Trust | -- | None Listed On Document | |
| Soutor Todd | -- | Hickman Land Title Co | |
| Jones Kyle | -- | Us Title |
Source: Public Records
Mortgage History
| Date | Status | Borrower | Loan Amount |
|---|---|---|---|
| Previous Owner | Soutor Todd | $260,000 | |
| Previous Owner | Jones Kyle | $152,000 |
Source: Public Records
Tax History Compared to Growth
Tax History
| Year | Tax Paid | Tax Assessment Tax Assessment Total Assessment is a certain percentage of the fair market value that is determined by local assessors to be the total taxable value of land and additions on the property. | Land | Improvement |
|---|---|---|---|---|
| 2024 | $3,575 | $366,300 | $187,800 | $178,500 |
| 2023 | $3,500 | $650,000 | $224,853 | $425,147 |
| 2022 | $3,705 | $375,650 | $124,339 | $251,311 |
| 2021 | $3,152 | $483,000 | $183,593 | $299,407 |
| 2020 | $2,823 | $419,000 | $155,731 | $263,269 |
| 2019 | $2,675 | $392,000 | $152,327 | $239,673 |
| 2018 | $2,519 | $364,000 | $144,306 | $219,694 |
| 2016 | $2,303 | $173,360 | $62,396 | $110,964 |
| 2015 | $2,301 | $164,670 | $62,396 | $102,274 |
| 2014 | $1,955 | $148,317 | $61,827 | $86,490 |
| 2013 | -- | $158,417 | $55,228 | $103,189 |
Source: Public Records
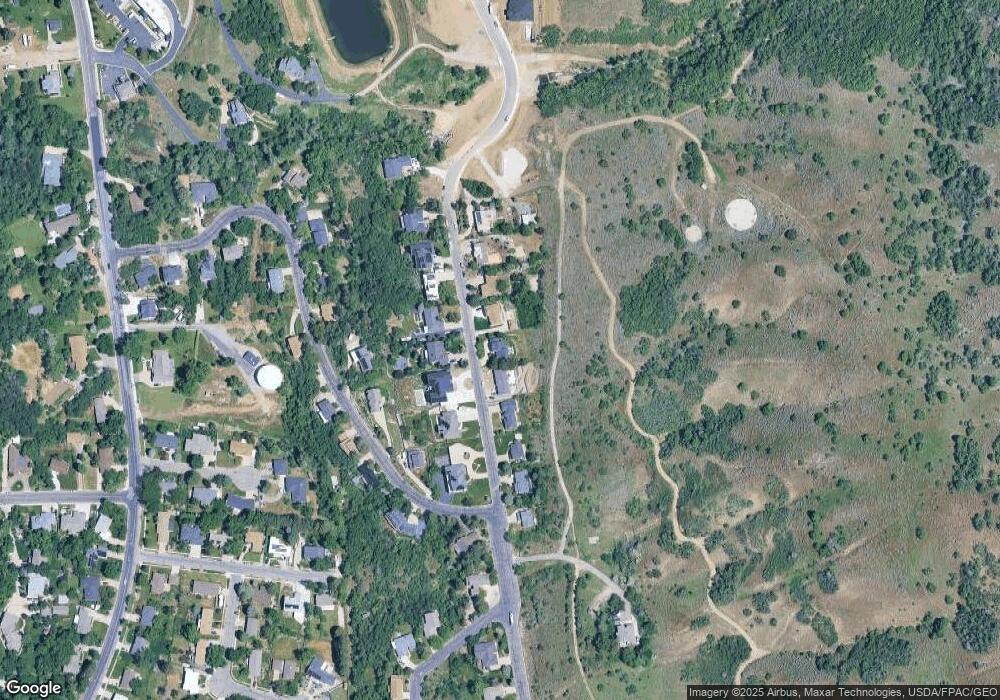
Map
Nearby Homes
- 358 S Eastoaks Dr
- 570 S 1800 E
- 362 Glen Cir
- 1644 E Old Lake Ln
- 399 Stirling Dr E
- 1351 E 400 S
- 1419 E Heights Way Unit 15
- 1543 Mirabella Way Unit 21
- 1425 250 N
- 1730 250 N Unit 23-R
- 1616 250 N Unit 26-R
- 1779 250 N Unit 29-R
- 1053 Sage Ln
- 2076 Summerwood Dr
- 998 E Country Rd
- 947 E Green Rd
- 1043 S Oxford Cir
- 1347 E 650 N Unit 1
- 1370 Oakmont Ln
- 960 E Par Three Cir
- 389 S 1800 E
- 433 S 1800 E
- 377 S 1800 E
- 457 S 1800 E
- 430 S 1800 E Unit 56
- 406 S 1800 E
- 353 S 1800 E
- 368 S 1800 E
- 471 S 1800 E
- 454 S 1800 E Unit 57
- 382 S 1800 E
- 331 S 1800 E
- 487 S 1800 E
- 482 S 1800 E
- 378 Eastoaks Dr
- 344 S 1800 E
- 344 S 1800 E Unit 52
- 415 Eastoaks Dr
- 441 S Eastoaks Dr Unit 2
- 441 S Eastoaks Dr