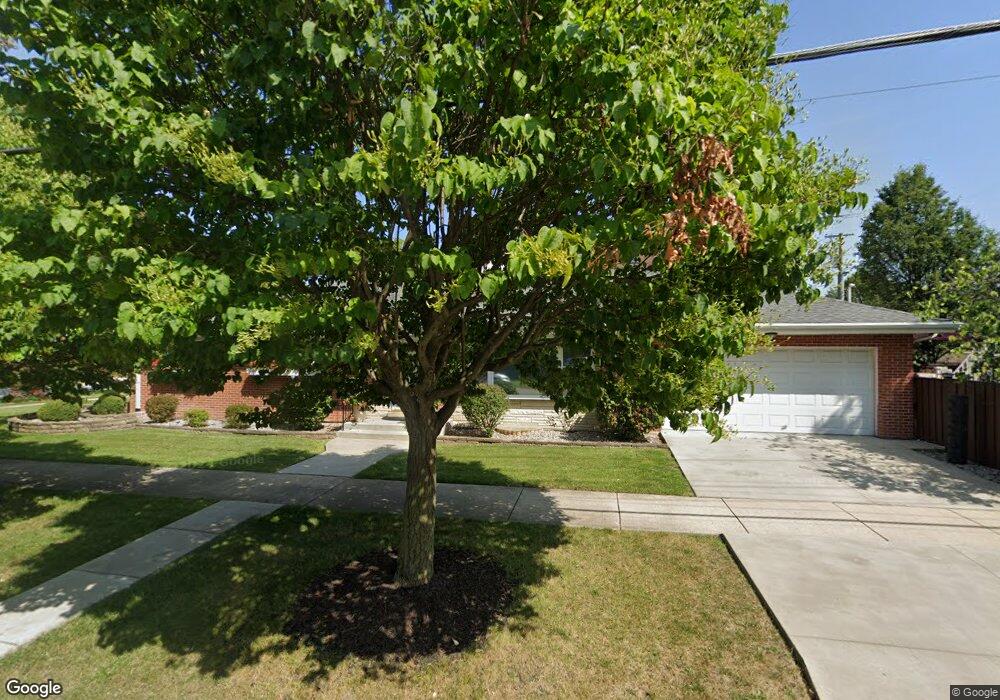
415 S Delphia Ave Park Ridge, IL 60068
Estimated Value: $542,000 - $642,000
3
Beds
2
Baths
1,421
Sq Ft
$421/Sq Ft
Est. Value
About This Home
This home is located at 415 S Delphia Ave, Park Ridge, IL 60068 and is currently estimated at $597,651, approximately $420 per square foot. 415 S Delphia Ave is a home located in Cook County with nearby schools including George Washington Elementary School, Lincoln Middle School, and Maine South High School.
Ownership History
Date
Name
Owned For
Owner Type
Purchase Details
Closed on
Dec 29, 2008
Sold by
Deutsche Bank National Trust Company
Bought by
Andreolas Nicholas and Andreolas Renee
Current Estimated Value
Home Financials for this Owner
Home Financials are based on the most recent Mortgage that was taken out on this home.
Original Mortgage
$315,425
Interest Rate
5.06%
Mortgage Type
FHA
Purchase Details
Closed on
Oct 6, 2008
Sold by
Staunton Hugh
Bought by
Deutsche Bank National Trust Company
Purchase Details
Closed on
Sep 21, 2005
Sold by
Schaffer James J and Schaffer Mary
Bought by
Staunton Hugh
Home Financials for this Owner
Home Financials are based on the most recent Mortgage that was taken out on this home.
Original Mortgage
$525,000
Interest Rate
6.5%
Mortgage Type
Unknown
Create a Home Valuation Report for This Property
The Home Valuation Report is an in-depth analysis detailing your home's value as well as a comparison with similar homes in the area
Home Values in the Area
Average Home Value in this Area
Purchase History
| Date | Buyer | Sale Price | Title Company |
|---|---|---|---|
| Andreolas Nicholas | $320,000 | First American Title | |
| Deutsche Bank National Trust Company | -- | First American Title | |
| Staunton Hugh | $525,000 | Agtf Inc |
Source: Public Records
Mortgage History
| Date | Status | Borrower | Loan Amount |
|---|---|---|---|
| Previous Owner | Andreolas Nicholas | $315,425 | |
| Previous Owner | Staunton Hugh | $525,000 |
Source: Public Records
Tax History Compared to Growth
Tax History
| Year | Tax Paid | Tax Assessment Tax Assessment Total Assessment is a certain percentage of the fair market value that is determined by local assessors to be the total taxable value of land and additions on the property. | Land | Improvement |
|---|---|---|---|---|
| 2024 | $9,516 | $36,487 | $10,540 | $25,947 |
| 2023 | $9,523 | $40,040 | $10,540 | $29,500 |
| 2022 | $9,523 | $40,040 | $10,540 | $29,500 |
| 2021 | $8,349 | $30,781 | $6,510 | $24,271 |
| 2020 | $9,296 | $34,930 | $6,510 | $28,420 |
| 2019 | $10,712 | $44,528 | $6,510 | $38,018 |
| 2018 | $7,067 | $28,131 | $5,580 | $22,551 |
| 2017 | $7,593 | $30,021 | $5,580 | $24,441 |
| 2016 | $8,024 | $31,741 | $5,580 | $26,161 |
| 2015 | $8,523 | $30,256 | $4,650 | $25,606 |
| 2014 | $8,371 | $30,256 | $4,650 | $25,606 |
| 2013 | $7,912 | $30,256 | $4,650 | $25,606 |
Source: Public Records
Map
Nearby Homes
- 600 S Greenwood Ave
- 428 S Clifton Ave
- 1301 W Touhy Ave Unit 315
- 516 Engel Blvd
- 316 S Fairview Ave
- 425 W Talcott Rd
- 103 N Clifton Ave
- 301 S Prospect Ave
- 919 S Chester Ave
- 623 S Prospect Ave
- 1016 Arthur St
- 1014 S Chester Ave
- 929 S Aldine Ave
- 819 Albion Ave
- 1210 Elm St
- 820 W Talcott Rd
- 1228 Elm St
- 170 N Northwest Hwy Unit 407
- 170 N Northwest Hwy Unit 410
- 1116 S Cumberland Ave
- 407 S Delphia Ave
- 421 S Delphia Ave
- 403 S Delphia Ave
- 412 S Greenwood Ave
- 408 S Greenwood Ave
- 425 S Delphia Ave
- 404 S Greenwood Ave
- 420 S Greenwood Ave
- 412 S Delphia Ave
- 408 S Delphia Ave
- 329 S Delphia Ave
- 404 S Delphia Ave
- 400 S Greenwood Ave
- 429 S Delphia Ave
- 424 S Greenwood Ave
- 420 S Delphia Ave
- 400 S Delphia Ave
- 328 S Greenwood Ave
- 325 S Delphia Ave
- 430 S Greenwood Ave