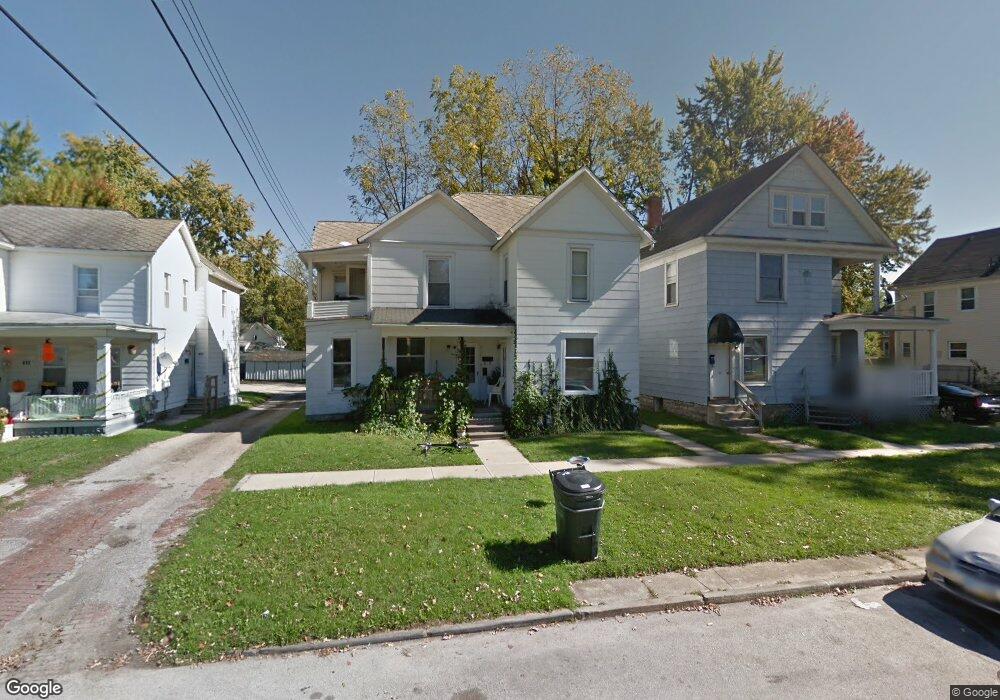
415 S Wood St Fremont, OH 43420
Estimated Value: $83,000 - $110,000
4
Beds
2
Baths
2,092
Sq Ft
$48/Sq Ft
Est. Value
About This Home
This home is located at 415 S Wood St, Fremont, OH 43420 and is currently estimated at $101,428, approximately $48 per square foot. 415 S Wood St is a home located in Sandusky County with nearby schools including Fremont Ross High School, St. Joseph School, and Bishop Hoffman Catholic School - This is St Joe's School now.
Ownership History
Date
Name
Owned For
Owner Type
Purchase Details
Closed on
May 31, 2024
Sold by
Roberts Joel D and Roberts Jennifer M
Bought by
Jeffer-Son Stephen and Hicks Ebonee
Current Estimated Value
Home Financials for this Owner
Home Financials are based on the most recent Mortgage that was taken out on this home.
Original Mortgage
$53,000
Outstanding Balance
$52,334
Interest Rate
7.1%
Mortgage Type
Seller Take Back
Estimated Equity
$49,094
Purchase Details
Closed on
Jan 25, 2017
Sold by
Roberts Joel D and Roberts Jennifer M
Bought by
Roberts Joel D and Roberts Jennifer M
Purchase Details
Closed on
Oct 1, 1991
Sold by
Roberts Joel D
Bought by
Roberts Joel D
Purchase Details
Closed on
Jan 1, 1991
Sold by
Roberts Joel D
Bought by
Roberts Joel D
Purchase Details
Closed on
Dec 1, 1990
Bought by
Roberts Joel D
Create a Home Valuation Report for This Property
The Home Valuation Report is an in-depth analysis detailing your home's value as well as a comparison with similar homes in the area
Home Values in the Area
Average Home Value in this Area
Purchase History
| Date | Buyer | Sale Price | Title Company |
|---|---|---|---|
| Jeffer-Son Stephen | $80,000 | None Listed On Document | |
| Jeffer-Son Stephen | $80,000 | None Listed On Document | |
| Roberts Joel D | -- | Attorney | |
| Roberts Joel D | $33,000 | -- | |
| Roberts Joel D | -- | -- | |
| Roberts Joel D | -- | -- |
Source: Public Records
Mortgage History
| Date | Status | Borrower | Loan Amount |
|---|---|---|---|
| Open | Jeffer-Son Stephen | $53,000 | |
| Closed | Jeffer-Son Stephen | $53,000 |
Source: Public Records
Tax History Compared to Growth
Tax History
| Year | Tax Paid | Tax Assessment Tax Assessment Total Assessment is a certain percentage of the fair market value that is determined by local assessors to be the total taxable value of land and additions on the property. | Land | Improvement |
|---|---|---|---|---|
| 2024 | $1,098 | $29,130 | $4,730 | $24,400 |
| 2023 | $1,098 | $23,110 | $3,750 | $19,360 |
| 2022 | $915 | $23,110 | $3,750 | $19,360 |
| 2021 | $990 | $23,110 | $3,750 | $19,360 |
| 2020 | $753 | $18,140 | $3,750 | $14,390 |
| 2019 | $752 | $18,140 | $3,750 | $14,390 |
| 2018 | $753 | $18,140 | $3,750 | $14,390 |
| 2017 | $727 | $17,440 | $3,750 | $13,690 |
| 2016 | $639 | $17,440 | $3,750 | $13,690 |
| 2015 | $629 | $17,440 | $3,750 | $13,690 |
| 2014 | $649 | $17,150 | $3,780 | $13,370 |
| 2013 | $740 | $17,150 | $3,780 | $13,370 |
Source: Public Records
Map
Nearby Homes
- 619 Hayes Ave
- 616 S Wood St
- 1015 Hayes Ave
- 1037 Buckland Ave
- 815 South St
- 515 S Arch St
- 625 Bush Place
- 1028 June St
- 1009 Napoleon St
- 1342 Mcpherson Blvd
- 905 Twinn St
- 1013 Whittlesey St
- 427 N Clover St
- 1611 Mcpherson Blvd
- 208 E State St
- 501 Jackson St Unit 50
- 516 N Front St
- 224 Sandusky Ave Unit 226
- 880 Cleveland Ave
- 1485 Autumn Woods Dr