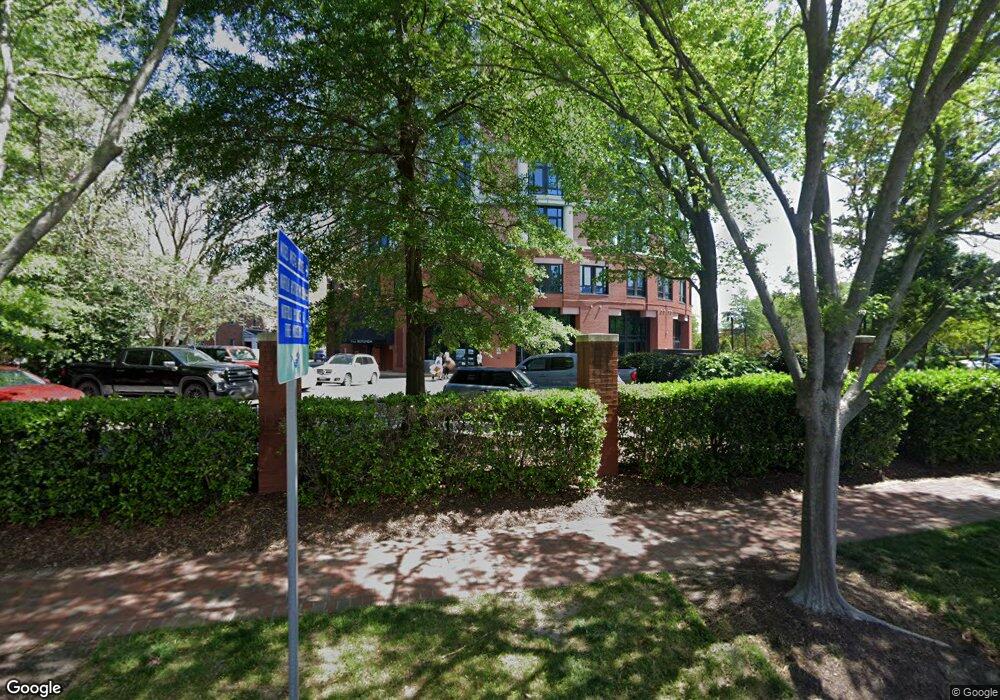
The Rotunda 415 Saint Pauls Blvd Unit 409 Norfolk, VA 23510
Downtown Norfolk NeighborhoodEstimated Value: $289,000 - $298,378
2
Beds
2
Baths
1,113
Sq Ft
$263/Sq Ft
Est. Value
About This Home
This home is located at 415 Saint Pauls Blvd Unit 409, Norfolk, VA 23510 and is currently estimated at $292,595, approximately $262 per square foot. 415 Saint Pauls Blvd Unit 409 is a home located in Norfolk City with nearby schools including P.B. Young Sr. Elementary School, Tidewater Park Elementary School, and Blair Middle School.
Ownership History
Date
Name
Owned For
Owner Type
Purchase Details
Closed on
Jun 12, 2012
Sold by
Rose Jimmy V and Rose Jimmy V
Bought by
Rose Family Investments Ii Llc
Current Estimated Value
Purchase Details
Closed on
Apr 12, 2010
Sold by
Jackson Gary C and Jackson Karen L
Bought by
Rose Jimmy
Purchase Details
Closed on
Jan 21, 2008
Sold by
The Rotunda Building Llc
Bought by
Jackson Gary C and Jackson Karen L
Create a Home Valuation Report for This Property
The Home Valuation Report is an in-depth analysis detailing your home's value as well as a comparison with similar homes in the area
Home Values in the Area
Average Home Value in this Area
Purchase History
| Date | Buyer | Sale Price | Title Company |
|---|---|---|---|
| Rose Family Investments Ii Llc | -- | None Available | |
| Rose Family Investments Ii Llc | -- | None Available | |
| Rose Jimmy | $200,000 | Stewart Title Guaranty Co | |
| Rose Jimmy | $200,000 | Stewart Title Guaranty Co | |
| Jackson Gary C | $370,000 | Advance Title & Abstract Inc | |
| Jackson Gary C | $370,000 | Advance Title & Abstract Inc |
Source: Public Records
Tax History Compared to Growth
Tax History
| Year | Tax Paid | Tax Assessment Tax Assessment Total Assessment is a certain percentage of the fair market value that is determined by local assessors to be the total taxable value of land and additions on the property. | Land | Improvement |
|---|---|---|---|---|
| 2025 | $4,633 | $328,600 | $46,700 | $281,900 |
| 2024 | $4,401 | $316,600 | $46,700 | $269,900 |
| 2023 | $4,183 | $296,700 | $39,000 | $257,700 |
| 2022 | $3,914 | $277,600 | $34,500 | $243,100 |
| 2021 | $3,715 | $263,500 | $34,500 | $229,000 |
| 2020 | $4,066 | $288,400 | $34,500 | $253,900 |
| 2019 | $4,102 | $290,900 | $34,500 | $256,400 |
| 2018 | $3,725 | $264,200 | $34,500 | $229,700 |
| 2017 | $3,458 | $264,000 | $34,300 | $229,700 |
| 2016 | $3,537 | $256,400 | $34,300 | $222,100 |
| 2015 | $3,359 | $256,400 | $34,300 | $222,100 |
| 2014 | $3,359 | $256,400 | $34,300 | $222,100 |
Source: Public Records
About The Rotunda
Map
Nearby Homes
- 415 Saint Pauls Blvd Unit 109
- 415 Saint Pauls Blvd Unit 709
- 415 Saint Pauls Blvd Unit 509
- 415 Saint Pauls Blvd Unit 309
- 415 Saint Pauls Blvd Unit 202
- 525 E Freemason St Unit 1A
- 435 E Freemason St Unit 3A
- 423 Saint Pauls Blvd Unit 2A
- 433 Saint Pauls Blvd Unit 2D
- 435 Monticello Ave Unit 300C
- 426 Granby St Unit 3C
- 500 Granby St Unit 4D
- 241 Granby St Unit 40
- 219 Granby St Unit 22
- 111 W Tazewell St Unit 304
- 123 College Place Unit 1402
- 123 College Place Unit P6
- 123 College Place Unit 805
- 388 Boush St Unit 217
- 388 Boush St Unit 302
- 415 Saint Pauls Blvd Unit 402
- 415 Saint Pauls Blvd Unit 308
- 415 Saint Pauls Blvd Unit 304
- 415 Saint Pauls Blvd Unit 112
- 415 Saint Pauls Blvd Unit 105
- 415 Saint Pauls Blvd Unit 609
- 415 Saint Pauls Blvd Unit 307
- 415 Saint Pauls Blvd Unit 201
- 415 Saint Pauls Blvd Unit 209
- 415 Saint Pauls Blvd Unit 705
- 415 Saint Pauls Blvd Unit 303
- 415 Saint Pauls Blvd Unit 601
- 415 Saint Pauls Blvd Unit 708
- 415 Saint Pauls Blvd Unit 204
- 415 Saint Pauls Blvd Unit 503
- 415 Saint Pauls Blvd Unit 405
- 415 Saint Pauls Blvd Unit 501
- 415 Saint Pauls Blvd Unit 102
- 415 Saint Pauls Blvd Unit 301
- 415 Saint Pauls Blvd Unit 103