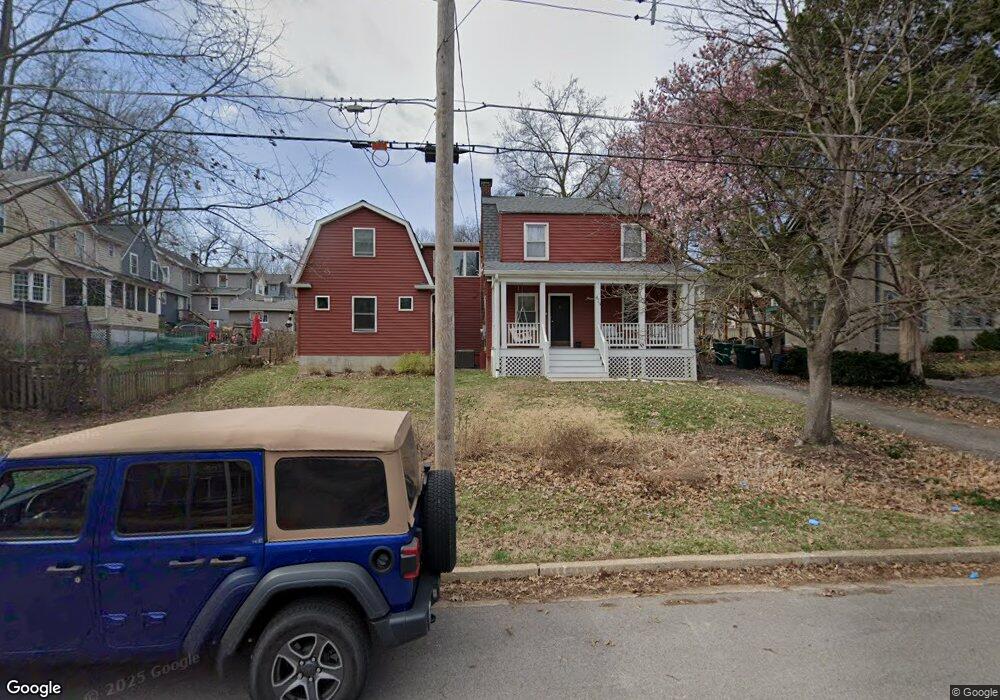
415 Spring Ave Saint Louis, MO 63119
Estimated Value: $517,000 - $698,000
4
Beds
4
Baths
2,919
Sq Ft
$221/Sq Ft
Est. Value
About This Home
This home is located at 415 Spring Ave, Saint Louis, MO 63119 and is currently estimated at $643,803, approximately $220 per square foot. 415 Spring Ave is a home located in St. Louis County with nearby schools including Avery Elementary School, Hixson Middle School, and Webster Groves High School.
Ownership History
Date
Name
Owned For
Owner Type
Purchase Details
Closed on
Jan 30, 2025
Sold by
Williams Kevin and Williams Allison
Bought by
Williams Qualified Spousal Trust and Williams
Current Estimated Value
Purchase Details
Closed on
Apr 2, 2004
Sold by
Polihan Thomas H
Bought by
Williams Kevin and Williams Allison
Home Financials for this Owner
Home Financials are based on the most recent Mortgage that was taken out on this home.
Original Mortgage
$204,400
Interest Rate
5.59%
Mortgage Type
Purchase Money Mortgage
Purchase Details
Closed on
Dec 2, 1999
Sold by
Pollihan Thomas H
Bought by
The Thomas H Pollihan Revocable Trust
Purchase Details
Closed on
Nov 30, 1999
Sold by
Pollihan Thomas H and Pollihan Donna M
Bought by
Pollihan Thomas H
Purchase Details
Closed on
Oct 31, 1997
Sold by
Serra David P
Bought by
Pollihan Thomas H and Pollihan Donna M
Purchase Details
Closed on
Sep 3, 1997
Sold by
Serra Karen L
Bought by
Serra David P
Create a Home Valuation Report for This Property
The Home Valuation Report is an in-depth analysis detailing your home's value as well as a comparison with similar homes in the area
Home Values in the Area
Average Home Value in this Area
Purchase History
| Date | Buyer | Sale Price | Title Company |
|---|---|---|---|
| Williams Qualified Spousal Trust | -- | None Listed On Document | |
| Williams Kevin | $255,500 | Capital Title Co Inc | |
| The Thomas H Pollihan Revocable Trust | -- | -- | |
| Pollihan Thomas H | -- | -- | |
| Pollihan Thomas H | -- | First American Title Ins Co | |
| Serra David P | -- | -- |
Source: Public Records
Mortgage History
| Date | Status | Borrower | Loan Amount |
|---|---|---|---|
| Previous Owner | Williams Kevin | $204,400 | |
| Closed | Williams Kevin | $25,550 |
Source: Public Records
Tax History Compared to Growth
Tax History
| Year | Tax Paid | Tax Assessment Tax Assessment Total Assessment is a certain percentage of the fair market value that is determined by local assessors to be the total taxable value of land and additions on the property. | Land | Improvement |
|---|---|---|---|---|
| 2025 | $7,000 | $118,150 | $61,810 | $56,340 |
| 2024 | $7,000 | $100,820 | $38,630 | $62,190 |
| 2023 | $6,966 | $100,820 | $38,630 | $62,190 |
| 2022 | $4,512 | $60,420 | $30,910 | $29,510 |
| 2021 | $4,497 | $60,420 | $30,910 | $29,510 |
| 2020 | $4,433 | $55,480 | $30,910 | $24,570 |
| 2019 | $4,401 | $55,480 | $30,910 | $24,570 |
| 2018 | $4,166 | $46,610 | $21,640 | $24,970 |
| 2017 | $4,138 | $46,610 | $21,640 | $24,970 |
| 2016 | $3,663 | $39,460 | $18,540 | $20,920 |
| 2015 | $3,676 | $39,460 | $18,540 | $20,920 |
| 2014 | $4,757 | $49,770 | $13,570 | $36,200 |
Source: Public Records
Map
Nearby Homes
- 946 Newport Ave
- 544 Summit Ave
- 400 Marion Ave
- 808 Greeley Ave
- 7723 Suffolk Ave
- 554 N Laclede Station Rd
- 570 N Laclede Station Rd
- 716 Clark Ave
- 7826 Grove Ave
- 940 Brookside Ave
- 619 N Bompart Ave
- 4 Saint Charles Place
- 6 Saint Charles Place
- 946 Marshall Ave Unit D
- 840 Marshall Ave
- 1045 Tuxedo Blvd
- 4126 Exeter Ave
- 1048 Kuhlman Ln
- 1052 Kuhlman Ln
- 25 Saint Charles Place
- 419 Spring Ave
- 675 Amelia Ave
- 681 Amelia Ave
- 671 Amelia Ave
- 872 Newport Ave
- 868 Newport Ave
- 410 Spring Ave
- 667 Amelia Ave
- 418 Spring Ave
- 414 Spring Ave
- 866 Newport Ave
- 412 Spring Ave
- 408 Spring Ave
- 424 Spring Ave
- 665 Amelia Ave
- 426 Spring Ave
- 864 Newport Ave
- 674 Amelia Ave
- 661 Amelia Ave
- 430 Spring Ave