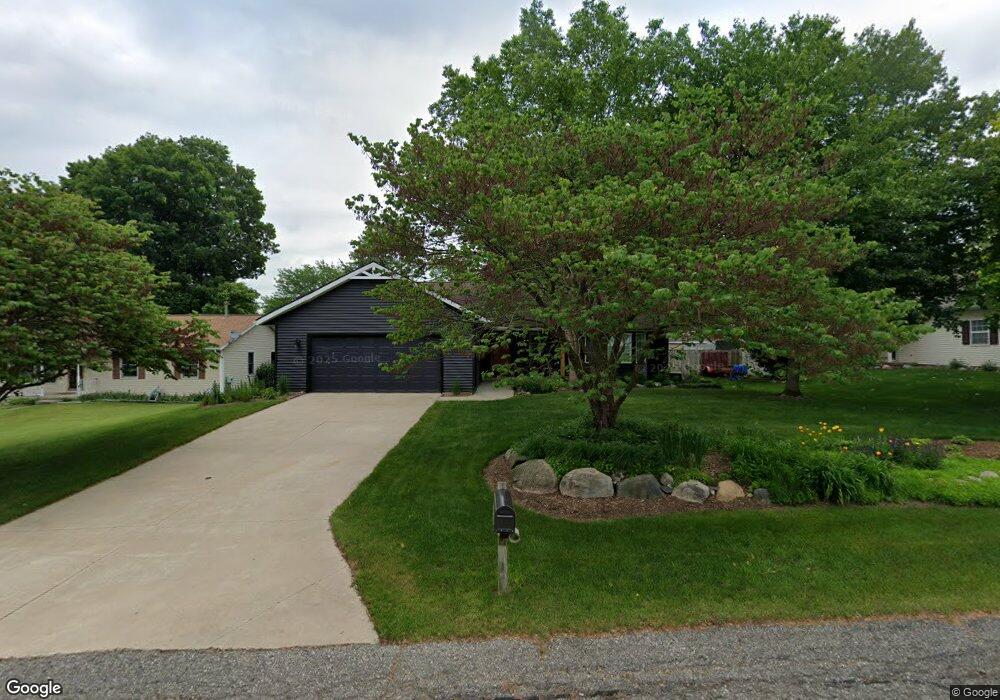
415 Standish Dr Wayland, MI 49348
Estimated Value: $295,928 - $354,000
4
Beds
2
Baths
1,376
Sq Ft
$241/Sq Ft
Est. Value
About This Home
This home is located at 415 Standish Dr, Wayland, MI 49348 and is currently estimated at $330,982, approximately $240 per square foot. 415 Standish Dr is a home located in Allegan County with nearby schools including Wayland High School and St. Therese Catholic School.
Ownership History
Date
Name
Owned For
Owner Type
Purchase Details
Closed on
Jun 5, 2018
Sold by
Wierenga Mark and Wierenga Sara L
Bought by
The Mark A Wierenga And Sara L Wierenga and Wierenga Sara L
Current Estimated Value
Purchase Details
Closed on
Oct 2, 1998
Sold by
Parsons Shirley A
Bought by
Harroun Sara L and Wierenga Mark
Purchase Details
Closed on
Jun 27, 1990
Bought by
Genther Robert L and Genther Alaine D
Purchase Details
Closed on
Mar 14, 1989
Bought by
Arc Construction
Create a Home Valuation Report for This Property
The Home Valuation Report is an in-depth analysis detailing your home's value as well as a comparison with similar homes in the area
Home Values in the Area
Average Home Value in this Area
Purchase History
| Date | Buyer | Sale Price | Title Company |
|---|---|---|---|
| The Mark A Wierenga And Sara L Wierenga | -- | None Available | |
| Harroun Sara L | $123,000 | -- | |
| Genther Robert L | $79,500 | -- | |
| Arc Construction | $14,000 | -- |
Source: Public Records
Tax History Compared to Growth
Tax History
| Year | Tax Paid | Tax Assessment Tax Assessment Total Assessment is a certain percentage of the fair market value that is determined by local assessors to be the total taxable value of land and additions on the property. | Land | Improvement |
|---|---|---|---|---|
| 2025 | $3,123 | $115,700 | $14,000 | $101,700 |
| 2024 | $2,837 | $102,900 | $11,200 | $91,700 |
| 2023 | $2,837 | $107,500 | $11,400 | $96,100 |
| 2022 | $2,837 | $95,700 | $10,400 | $85,300 |
| 2021 | $2,659 | $87,900 | $10,200 | $77,700 |
| 2020 | $2,659 | $85,500 | $10,200 | $75,300 |
| 2019 | $0 | $76,600 | $9,600 | $67,000 |
| 2018 | $0 | $70,800 | $9,600 | $61,200 |
| 2017 | $0 | $69,400 | $9,600 | $59,800 |
| 2016 | $0 | $60,900 | $9,600 | $51,300 |
| 2015 | -- | $60,900 | $9,600 | $51,300 |
| 2014 | -- | $58,000 | $11,600 | $46,400 |
| 2013 | -- | $54,100 | $11,600 | $42,500 |
Source: Public Records
Map
Nearby Homes
- 401 Anderson Dr
- 330 Lotz Ct
- 835 Wild Flower Ct
- 146 Hanlon Ct
- 212 E Superior St
- 110 E Sycamore St
- 621 S Main St
- 3282 Stonehill Ct
- 3296 Stonehill Ct
- 545 N Main St
- 319 Alpine St
- 219 Alpine St
- 3610 Garden St
- 3685 Calkins Ct
- 3770 Division Ave S
- 1143 Regina Trail
- 3570 Windsor Woods Dr
- 4674 12th St
- 3214 7th St
- 3897 Division St