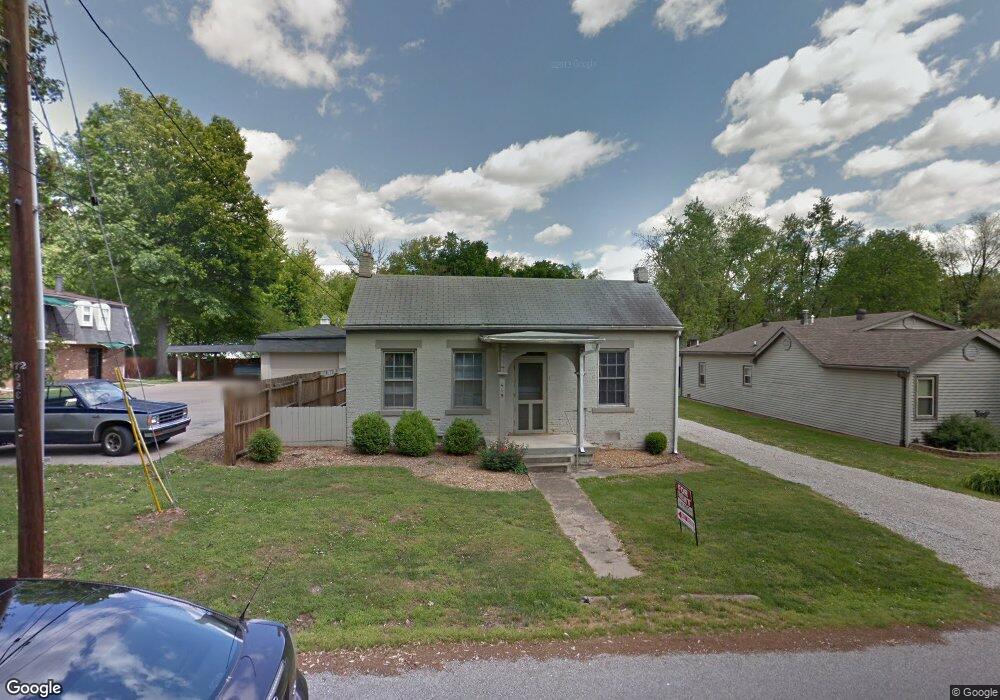
415 Sycamore St Newburgh, IN 47630
Estimated Value: $169,000 - $194,293
1
Bed
1
Bath
947
Sq Ft
$189/Sq Ft
Est. Value
About This Home
This home is located at 415 Sycamore St, Newburgh, IN 47630 and is currently estimated at $178,573, approximately $188 per square foot. 415 Sycamore St is a home located in Warrick County with nearby schools including Newburgh Elementary School, Castle North Middle School, and Castle High School.
Ownership History
Date
Name
Owned For
Owner Type
Purchase Details
Closed on
Dec 14, 2021
Sold by
Casey Robert W and Casey Rebecca L
Bought by
Wynn Tracey J
Current Estimated Value
Home Financials for this Owner
Home Financials are based on the most recent Mortgage that was taken out on this home.
Original Mortgage
$155,000
Outstanding Balance
$141,043
Interest Rate
3.09%
Mortgage Type
New Conventional
Estimated Equity
$37,530
Purchase Details
Closed on
Sep 29, 2020
Sold by
Tfjs Properties Llc
Bought by
Casey Robert W and Casey Rebecca L
Create a Home Valuation Report for This Property
The Home Valuation Report is an in-depth analysis detailing your home's value as well as a comparison with similar homes in the area
Home Values in the Area
Average Home Value in this Area
Purchase History
| Date | Buyer | Sale Price | Title Company |
|---|---|---|---|
| Wynn Tracey J | $175,000 | Regional Title Services Llc | |
| Casey Robert W | -- | None Available |
Source: Public Records
Mortgage History
| Date | Status | Borrower | Loan Amount |
|---|---|---|---|
| Open | Wynn Tracey J | $155,000 |
Source: Public Records
Tax History
| Year | Tax Paid | Tax Assessment Tax Assessment Total Assessment is a certain percentage of the fair market value that is determined by local assessors to be the total taxable value of land and additions on the property. | Land | Improvement |
|---|---|---|---|---|
| 2025 | $1,021 | $140,400 | $34,700 | $105,700 |
| 2024 | $1,021 | $131,200 | $34,700 | $96,500 |
| 2023 | $947 | $130,500 | $34,700 | $95,800 |
| 2022 | $443 | $85,100 | $11,900 | $73,200 |
| 2021 | $320 | $68,100 | $9,500 | $58,600 |
| 2020 | $1,304 | $65,200 | $9,500 | $55,700 |
| 2019 | $1,136 | $56,800 | $9,500 | $47,300 |
| 2018 | $1,052 | $52,600 | $9,500 | $43,100 |
| 2017 | $1,038 | $51,900 | $9,500 | $42,400 |
| 2016 | $1,010 | $50,500 | $8,200 | $42,300 |
| 2014 | $918 | $45,900 | $9,000 | $36,900 |
| 2013 | $888 | $45,400 | $9,000 | $36,400 |
Source: Public Records
Map
Nearby Homes
- 110 E Gray St
- 8 E Gray St
- 209 Sycamore St
- 709 Cypress St
- 210 E Main St
- 217 Monroe St
- 318 E Main St
- 626 Monroe St
- 101 E Jennings St Unit E
- 110 Monroe St
- 305 E Jennings St
- 322 Shady Ln
- 630 E Main St
- 223 W Jennings St
- 408 W Water St
- 422 W Water St
- 706 Rose Dr
- 5610 Saint Catherine Ct
- 1 Yorkshire Dr
- 5233 State Route 261
Your Personal Tour Guide
Ask me questions while you tour the home.