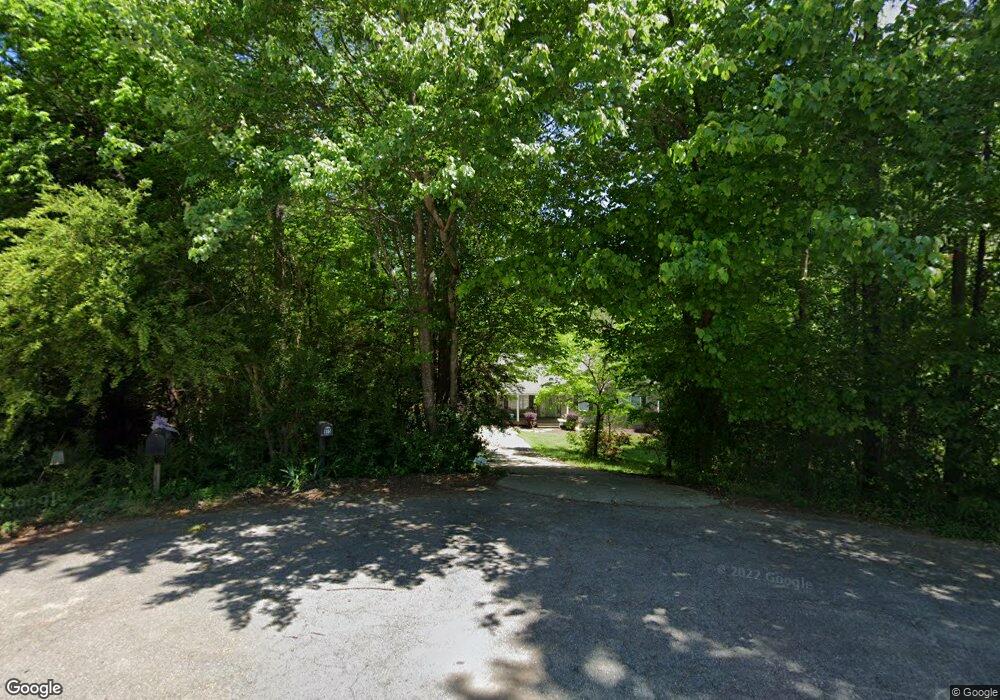
415 Tabby Ln Winder, GA 30680
Estimated Value: $303,250 - $342,000
Studio
2
Baths
1,393
Sq Ft
$227/Sq Ft
Est. Value
About This Home
This home is located at 415 Tabby Ln, Winder, GA 30680 and is currently estimated at $316,563, approximately $227 per square foot. 415 Tabby Ln is a home located in Barrow County with nearby schools including Holsenbeck Elementary School, Bear Creek Middle School, and Winder-Barrow High School.
Ownership History
Date
Name
Owned For
Owner Type
Purchase Details
Closed on
Jun 9, 1999
Sold by
Timmerman Jerry F
Bought by
Freeman Brain and Freeman Jennifer
Current Estimated Value
Home Financials for this Owner
Home Financials are based on the most recent Mortgage that was taken out on this home.
Original Mortgage
$10,487
Interest Rate
7.13%
Mortgage Type
New Conventional
Purchase Details
Closed on
Apr 2, 1990
Sold by
Gaston Acres
Bought by
Dorch Janet 55% Int
Create a Home Valuation Report for This Property
The Home Valuation Report is an in-depth analysis detailing your home's value as well as a comparison with similar homes in the area
Home Values in the Area
Average Home Value in this Area
Purchase History
| Date | Buyer | Sale Price | Title Company |
|---|---|---|---|
| Freeman Brain | $4,800 | -- | |
| Freeman Brian | $5,800 | -- | |
| Dorch Janet 55% Int | -- | -- |
Source: Public Records
Mortgage History
| Date | Status | Borrower | Loan Amount |
|---|---|---|---|
| Closed | Freeman Brian | $10,487 |
Source: Public Records
Tax History
| Year | Tax Paid | Tax Assessment Tax Assessment Total Assessment is a certain percentage of the fair market value that is determined by local assessors to be the total taxable value of land and additions on the property. | Land | Improvement |
|---|---|---|---|---|
| 2025 | $2,386 | $102,303 | $26,000 | $76,303 |
| 2024 | $2,401 | $100,331 | $26,000 | $74,331 |
| 2023 | $1,785 | $92,331 | $18,000 | $74,331 |
| 2022 | $2,254 | $82,066 | $18,000 | $64,066 |
| 2021 | $2,024 | $70,168 | $14,000 | $56,168 |
| 2020 | $1,613 | $56,320 | $12,000 | $44,320 |
| 2019 | $1,641 | $56,320 | $12,000 | $44,320 |
| 2018 | $1,617 | $56,320 | $12,000 | $44,320 |
| 2017 | $1,430 | $49,109 | $10,200 | $38,909 |
| 2016 | $1,199 | $43,505 | $9,400 | $34,105 |
| 2015 | $1,216 | $43,887 | $9,400 | $34,487 |
| 2014 | $1,094 | $39,583 | $5,096 | $34,487 |
| 2013 | -- | $37,452 | $5,096 | $32,356 |
Source: Public Records
Map
Nearby Homes
- 372 Ashton Way
- 475 Pendergrass Rd
- 421 Arrowhatchee Dr
- 466 Pendergrass Rd
- 547 Hickeria Way
- 303 Rooks Rd
- 58 Cedar Bluff
- 615 Gainesville Hwy
- 0 Sims Rd Unit 10674254
- 457 Banff Dr
- 543 Calgary Downs Dr
- 454 Banff Dr
- 450 Banff Dr
- 5 Olevia St
- 448 Banff Dr
- 446 Banff Dr
- 1815 Alberta Ln
- 116 Wisteria Dr
- 132 Wisteria Dr
- 136 Wisteria Dr
Your Personal Tour Guide
Ask me questions while you tour the home.