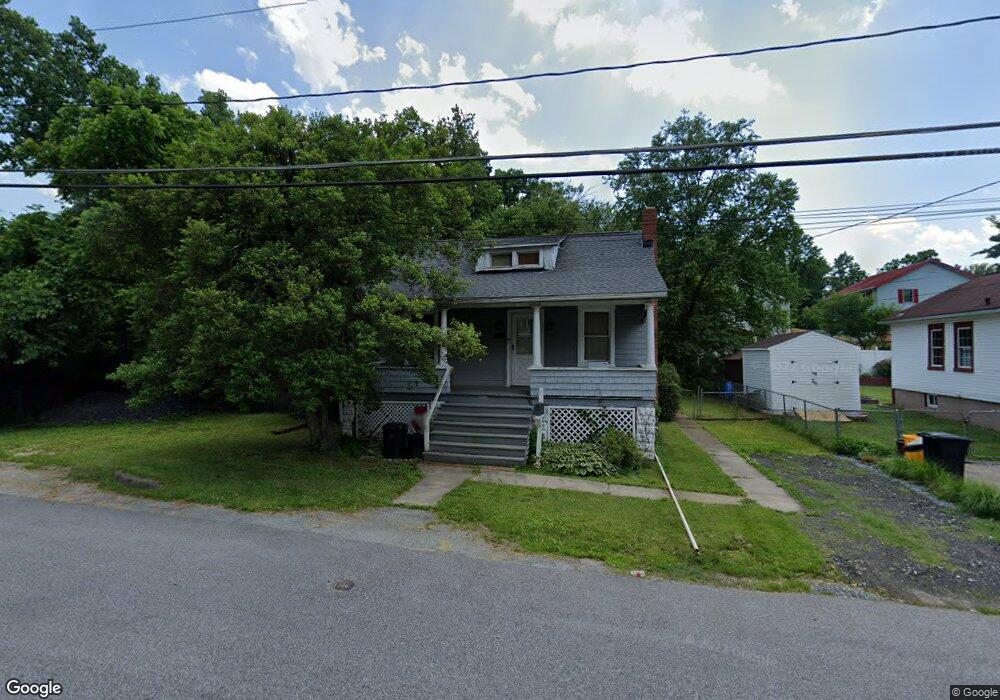
415 Third Ave Halethorpe, MD 21227
Lansdowne NeighborhoodEstimated Value: $213,000 - $297,000
Studio
2
Baths
1,116
Sq Ft
$233/Sq Ft
Est. Value
About This Home
This home is located at 415 Third Ave, Halethorpe, MD 21227 and is currently estimated at $259,614, approximately $232 per square foot. 415 Third Ave is a home located in Baltimore County with nearby schools including Lansdowne Elementary School, Lansdowne Middle School, and Lansdowne High School.
Ownership History
Date
Name
Owned For
Owner Type
Purchase Details
Closed on
Oct 16, 2006
Sold by
White Jeffrey
Bought by
White Lynn A
Current Estimated Value
Home Financials for this Owner
Home Financials are based on the most recent Mortgage that was taken out on this home.
Original Mortgage
$115,000
Outstanding Balance
$70,015
Interest Rate
6.83%
Mortgage Type
Stand Alone Refi Refinance Of Original Loan
Estimated Equity
$189,599
Purchase Details
Closed on
Aug 16, 2006
Sold by
White Jeffrey
Bought by
White Lynn A
Home Financials for this Owner
Home Financials are based on the most recent Mortgage that was taken out on this home.
Original Mortgage
$115,000
Interest Rate
6.83%
Mortgage Type
New Conventional
Purchase Details
Closed on
Sep 2, 2003
Sold by
Bussard Timothy M
Bought by
White Jeffrey
Purchase Details
Closed on
Mar 21, 1997
Sold by
Nguyen Win V
Bought by
Bussard Timothy M
Create a Home Valuation Report for This Property
The Home Valuation Report is an in-depth analysis detailing your home's value as well as a comparison with similar homes in the area
Home Values in the Area
Average Home Value in this Area
Purchase History
| Date | Buyer | Sale Price | Title Company |
|---|---|---|---|
| White Lynn A | -- | -- | |
| White Lynn A | -- | -- | |
| White Jeffrey | $115,000 | -- | |
| Bussard Timothy M | $70,000 | -- |
Source: Public Records
Mortgage History
| Date | Status | Borrower | Loan Amount |
|---|---|---|---|
| Open | White Lynn A | $115,000 | |
| Previous Owner | White Lynn A | $115,000 |
Source: Public Records
Tax History
| Year | Tax Paid | Tax Assessment Tax Assessment Total Assessment is a certain percentage of the fair market value that is determined by local assessors to be the total taxable value of land and additions on the property. | Land | Improvement |
|---|---|---|---|---|
| 2025 | $2,937 | $189,900 | -- | -- |
| 2024 | $2,937 | $177,200 | $62,600 | $114,600 |
| 2023 | $1,455 | $175,167 | $0 | $0 |
| 2022 | $1,949 | $173,133 | $0 | $0 |
| 2021 | $2,529 | $171,100 | $62,600 | $108,500 |
| 2020 | $2,041 | $168,367 | $0 | $0 |
| 2019 | $2,007 | $165,633 | $0 | $0 |
| 2018 | $2,587 | $162,900 | $62,600 | $100,300 |
| 2017 | $2,324 | $158,700 | $0 | $0 |
| 2016 | $1,790 | $154,500 | $0 | $0 |
| 2015 | $1,790 | $150,300 | $0 | $0 |
| 2014 | $1,790 | $150,300 | $0 | $0 |
Source: Public Records
Map
Nearby Homes
- 302 4th Ave
- 418 1st Ave
- 216 Clyde Ave
- 238 Elizabeth Ave
- 2405 Brunswick Rd
- 106 4th Ave
- 801 Seckel Ct
- 151 Howard Ave
- 0 Hammonds Ferry Rd
- 35 Elizabeth Ave
- 3254 Ryerson Cir
- 2407 Hammonds Ferry Rd
- 3216 Ryerson Cir
- 211 Green Fern Way
- 3225 Ryerson Cir
- 3207 Janice Ave
- 2127 Gaylawn Dr
- 2747 Park Dr
- 0 Monumental Ave Unit MDBC2082542
- 3202 Garden Ave
Your Personal Tour Guide
Ask me questions while you tour the home.