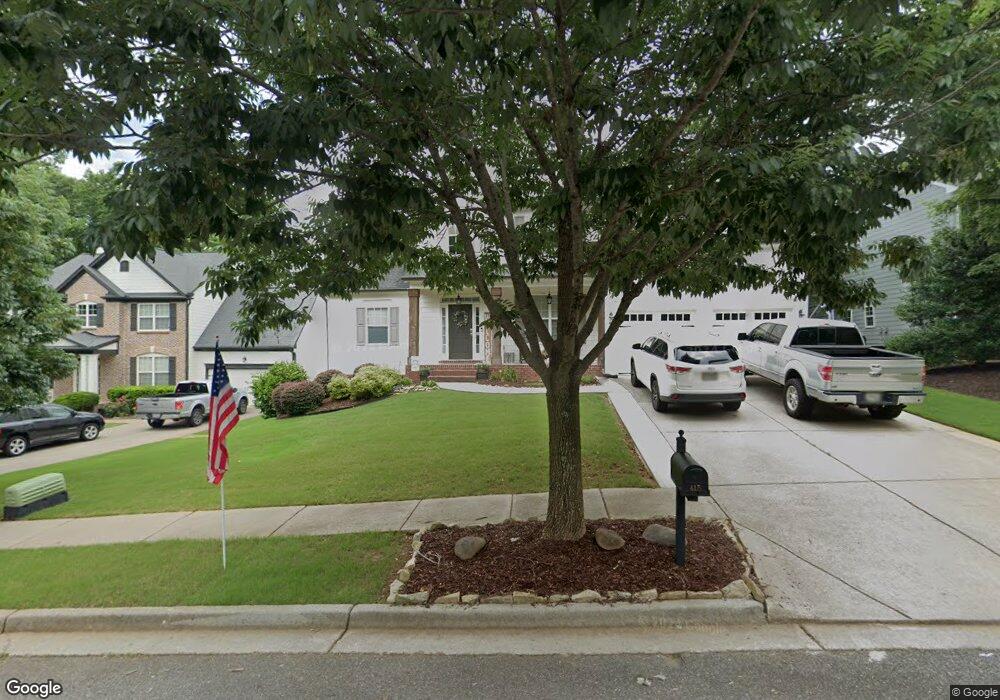
415 Treetop Cir Canton, GA 30115
Estimated Value: $586,000 - $624,968
5
Beds
3
Baths
2,639
Sq Ft
$229/Sq Ft
Est. Value
About This Home
This home is located at 415 Treetop Cir, Canton, GA 30115 and is currently estimated at $605,484, approximately $229 per square foot. 415 Treetop Cir is a home located in Cherokee County with nearby schools including Indian Knoll Elementary School, Rusk Middle School, and Sequoyah High School.
Ownership History
Date
Name
Owned For
Owner Type
Purchase Details
Closed on
Feb 28, 2020
Sold by
Ondeck Shawn A
Bought by
Ondeck Shawn A and Ondeck Andrea
Current Estimated Value
Home Financials for this Owner
Home Financials are based on the most recent Mortgage that was taken out on this home.
Original Mortgage
$282,445
Outstanding Balance
$249,066
Interest Rate
3.5%
Mortgage Type
VA
Estimated Equity
$356,418
Purchase Details
Closed on
Dec 19, 2011
Sold by
Sinsel Christine N
Bought by
Ondeck Shawn A
Home Financials for this Owner
Home Financials are based on the most recent Mortgage that was taken out on this home.
Original Mortgage
$217,579
Interest Rate
4.06%
Mortgage Type
VA
Purchase Details
Closed on
Apr 21, 2006
Sold by
Sharp Residential Builders
Bought by
Sinsel Keith A and Sinsel Christine
Home Financials for this Owner
Home Financials are based on the most recent Mortgage that was taken out on this home.
Original Mortgage
$220,453
Interest Rate
6.28%
Mortgage Type
New Conventional
Create a Home Valuation Report for This Property
The Home Valuation Report is an in-depth analysis detailing your home's value as well as a comparison with similar homes in the area
Home Values in the Area
Average Home Value in this Area
Purchase History
| Date | Buyer | Sale Price | Title Company |
|---|---|---|---|
| Ondeck Shawn A | -- | -- | |
| Ondeck Shawn A | $213,000 | -- | |
| Sinsel Keith A | $283,300 | -- |
Source: Public Records
Mortgage History
| Date | Status | Borrower | Loan Amount |
|---|---|---|---|
| Open | Ondeck Shawn A | $282,445 | |
| Previous Owner | Ondeck Shawn A | $217,579 | |
| Previous Owner | Sinsel Keith A | $220,453 |
Source: Public Records
Tax History Compared to Growth
Tax History
| Year | Tax Paid | Tax Assessment Tax Assessment Total Assessment is a certain percentage of the fair market value that is determined by local assessors to be the total taxable value of land and additions on the property. | Land | Improvement |
|---|---|---|---|---|
| 2025 | $11,885 | $239,800 | $46,000 | $193,800 |
| 2024 | $6,945 | $236,360 | $46,000 | $190,360 |
| 2023 | $6,851 | $227,680 | $46,000 | $181,680 |
| 2022 | $5,192 | $170,760 | $32,000 | $138,760 |
| 2021 | $4,017 | $160,080 | $28,840 | $131,240 |
| 2020 | $4,086 | $123,040 | $26,000 | $97,040 |
| 2019 | $3,101 | $123,320 | $26,000 | $97,320 |
| 2018 | $3,893 | $115,400 | $22,400 | $93,000 |
| 2017 | $3,832 | $284,600 | $22,400 | $91,440 |
| 2016 | $2,957 | $287,200 | $22,400 | $92,480 |
| 2015 | $2,692 | $259,200 | $20,000 | $83,680 |
| 2014 | $2,362 | $226,900 | $18,000 | $72,760 |
Source: Public Records
Map
Nearby Homes
- 200 Cherokee Reserve Cir
- 243 Harmony Lake Dr
- 244 Harmony Lake Dr
- 609 Darnell Rd
- 642 Royal Crest Ct
- 646 Royal Crest Ct
- 417 Darnell Rd
- 212 Reserve Crossing
- 202 Reserve Crossing
- 405 Royal Crescent Ln E
- 412 Middlebrooke St
- 501 Middlebrooke Trace
- 6560 Hickory Flat Hwy
- 351 Reserve Overlook Way
- 175 Treeline Trail
- 202 Hickory Nut Ln
- 309 Sassafras Crossing
- 417 Treetop Cir
- 413 Treetop Cir
- 419 Treetop Cir
- 578 Tom Charles Ln
- 411 Treetop Cir
- 404 Treetop Cir
- 402 Treetop Cir
- 421 Treetop Cir
- 409 Treetop Cir
- 406 Treetop Cir
- 407 Treetop Cir
- 0 Treetop Cir Unit 7455344
- 0 Treetop Cir Unit 3241587
- 0 Treetop Cir Unit 7007775
- 0 Treetop Cir Unit 3123747
- 265 Harmony Lake Dr
- 263 Harmony Lake Dr
- 405 Treetop Cir
- 542 Tom Charles Ln
- 261 Harmony Lake Dr