
Landlord's Agent in 2022
George Brown
Patterson Schwartz
(302) 530-8867
1 in this area
63 Total Sales
Estimated Value: $439,638 - $622,000
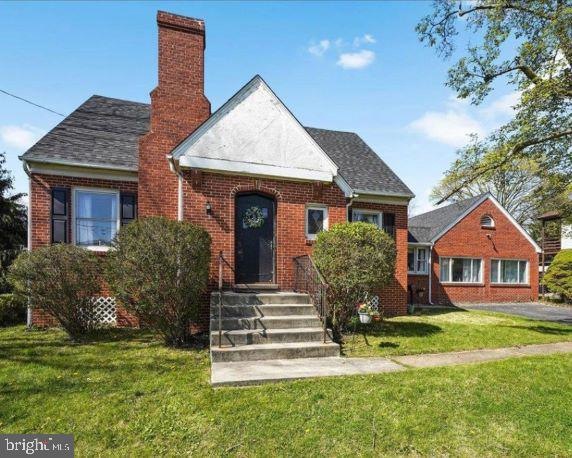
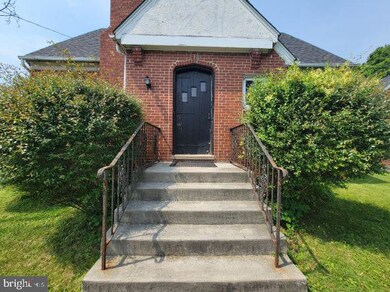
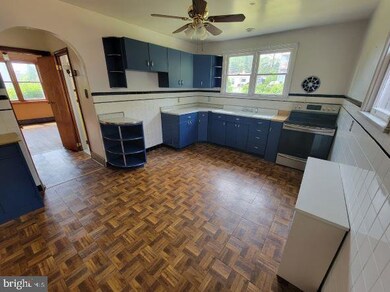
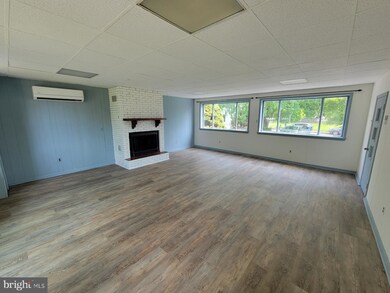
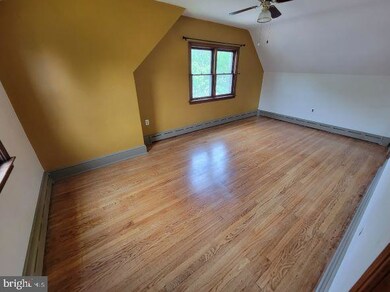
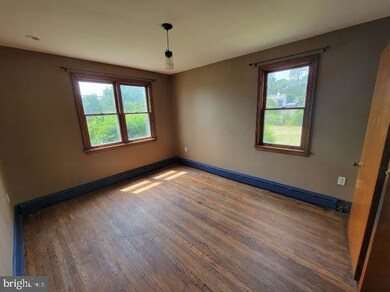
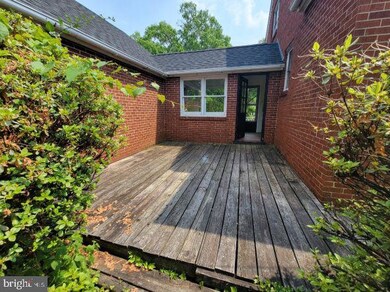
Beautiful 3 bedroom 1. 5 bath brick Cape Cod featuring lovely rear yard for comfort and pleasure. Features beautiful hardwood floors, huge family room with fireplace , first floor bedroom, huge kitchen with plenty of cabinets, two large bedrooms and bath on 2nd level, , outside basement entrance, parking to fit 4 cars or more, and treed lot. Requirements are $40 application fee made out to G.B, Brown Real Estate, Inc, 30-day pay stubs, 30 -bank statements, and copy of photo id per each adult. Ready to move in now. One month rent and one month security deposit upon signing lease.
Last Agent to Rent the Property
(302) 530-8867 gbrown8749@gmail.com Patterson-Schwartz-Hockessin Listed on: 06/03/2022
| Date | Buyer | Sale Price | Title Company |
|---|---|---|---|
| Eveland Barry J | $389,900 | None Listed On Document | |
| Speers Robert B | $146,000 | None Available |
| Date | Status | Borrower | Loan Amount |
|---|---|---|---|
| Open | Eveland Barry J | $321,415 | |
| Previous Owner | Speers Robert B | $134,100 |
| Date | Event | Price | List to Sale | Price per Sq Ft | Prior Sale |
|---|---|---|---|---|---|
| 06/28/2022 06/28/22 | Rented | $2,700 | 0.0% | -- | |
| 06/21/2022 06/21/22 | Under Contract | -- | -- | -- | |
| 06/17/2022 06/17/22 | For Rent | $2,700 | 0.0% | -- | |
| 06/10/2022 06/10/22 | Under Contract | -- | -- | -- | |
| 06/03/2022 06/03/22 | For Rent | $2,700 | 0.0% | -- | |
| 06/01/2022 06/01/22 | Sold | $389,900 | +2.6% | $183 / Sq Ft | View Prior Sale |
| 04/22/2022 04/22/22 | Pending | -- | -- | -- | |
| 04/21/2022 04/21/22 | For Sale | $379,900 | +160.2% | $178 / Sq Ft | |
| 01/23/2013 01/23/13 | Sold | $146,000 | -11.5% | $68 / Sq Ft | View Prior Sale |
| 11/17/2012 11/17/12 | Pending | -- | -- | -- | |
| 10/25/2012 10/25/12 | Price Changed | $164,900 | +1.5% | $77 / Sq Ft | |
| 10/24/2012 10/24/12 | For Sale | $162,500 | 0.0% | $76 / Sq Ft | |
| 09/25/2012 09/25/12 | Pending | -- | -- | -- | |
| 08/28/2012 08/28/12 | Price Changed | $162,500 | -7.1% | $76 / Sq Ft | |
| 08/07/2012 08/07/12 | Price Changed | $174,900 | -12.5% | $82 / Sq Ft | |
| 03/20/2012 03/20/12 | Price Changed | $199,900 | -14.9% | $94 / Sq Ft | |
| 01/31/2012 01/31/12 | For Sale | $234,900 | -- | $110 / Sq Ft |
| Year | Tax Paid | Tax Assessment Tax Assessment Total Assessment is a certain percentage of the fair market value that is determined by local assessors to be the total taxable value of land and additions on the property. | Land | Improvement |
|---|---|---|---|---|
| 2025 | $4,283 | $87,890 | $40,270 | $47,620 |
| 2024 | $4,283 | $87,890 | $40,270 | $47,620 |
| 2023 | $4,152 | $87,890 | $40,270 | $47,620 |
| 2022 | $3,794 | $87,890 | $40,270 | $47,620 |
| 2021 | $3,760 | $87,890 | $40,270 | $47,620 |
| 2020 | $3,697 | $87,890 | $40,270 | $47,620 |
| 2019 | $3,653 | $87,890 | $40,270 | $47,620 |
| 2018 | $3,568 | $87,890 | $40,270 | $47,620 |
| 2017 | $3,512 | $87,890 | $40,270 | $47,620 |
| 2016 | $577 | $87,890 | $40,270 | $47,620 |
| 2015 | $577 | $87,890 | $40,270 | $47,620 |
| 2014 | $577 | $87,890 | $40,270 | $47,620 |
Landlord's Agent in 2022
George Brown
Patterson Schwartz
(302) 530-8867
1 in this area
63 Total Sales
Seller's Agent in 2022
John Kriza
Beiler-Campbell Realtors-Kennett Square
(610) 721-6994
36 in this area
306 Total Sales
Tenant's Agent in 2022
Sean Reigel
EXP Realty, LLC
(484) 888-8965
4 in this area
44 Total Sales
C
Seller's Agent in 2013
Charles Rappa
Long & Foster
Source: Bright MLS
MLS Number: PACT2026084
APN: 03-002-0230.0100
Disclaimer: Certain information contained herein is derived from information provided by parties other than Homes.com. All information provided is deemed reliable, but is not guaranteed to be accurate and should be independently verified.
![]() The data relating to real estate for sale on this website appears in part through the BRIGHT Internet Data Exchange program, a voluntary cooperative exchange of property listing data between licensed real estate brokerage firms, and is provided by BRIGHT through a licensing agreement.
The data relating to real estate for sale on this website appears in part through the BRIGHT Internet Data Exchange program, a voluntary cooperative exchange of property listing data between licensed real estate brokerage firms, and is provided by BRIGHT through a licensing agreement.
Listing information is from various brokers who participate in the Bright MLS IDX program and not all listings may be visible on the site.
The property information being provided on or through the website is for the personal, non-commercial use of consumers and such information may not be used for any purpose other than to identify prospective properties consumers may be interested in purchasing.
Some properties which appear for sale on the website may no longer be available because they are for instance, under contract, sold or are no longer being offered for sale.
Property information displayed is deemed reliable but is not guaranteed.
Copyright 2025 Bright MLS, Inc.