Estimated Value: $319,778 - $343,000
3
Beds
2
Baths
1,624
Sq Ft
$204/Sq Ft
Est. Value
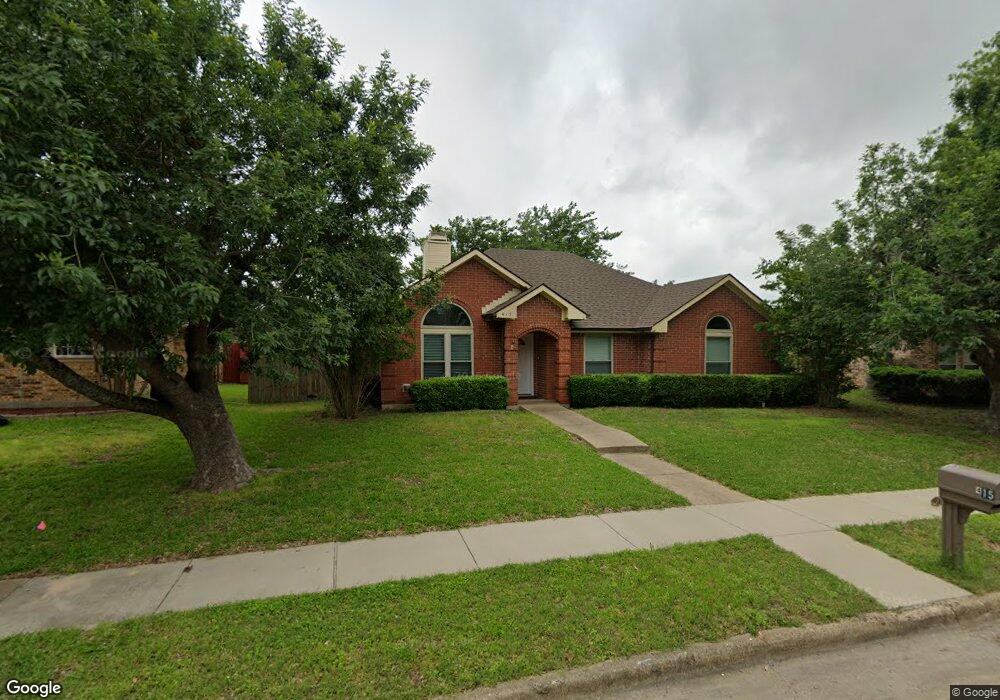
About This Home
This home is located at 415 W Jefferson St, Wylie, TX 75098 and is currently estimated at $330,695, approximately $203 per square foot. 415 W Jefferson St is a home located in Collin County with nearby schools including T.F. Birmingham Elementary School, Frank Mcmillan Junior High School, and Davis Intermediate School.
Ownership History
Date
Name
Owned For
Owner Type
Purchase Details
Closed on
Feb 14, 2017
Sold by
Brushwood Allen B and Brushwood Victoria
Bought by
Rodgers Jack S and Rodgers Retha A
Current Estimated Value
Purchase Details
Closed on
Dec 23, 2014
Sold by
Dxq Properties Llc
Bought by
Brushwood Allen B
Home Financials for this Owner
Home Financials are based on the most recent Mortgage that was taken out on this home.
Original Mortgage
$114,675
Interest Rate
4.05%
Mortgage Type
New Conventional
Purchase Details
Closed on
Nov 10, 2014
Sold by
Coffin Donna
Bought by
Dxq Properties Llc
Home Financials for this Owner
Home Financials are based on the most recent Mortgage that was taken out on this home.
Original Mortgage
$114,675
Interest Rate
4.05%
Mortgage Type
New Conventional
Purchase Details
Closed on
Sep 30, 2014
Sold by
Mezzell Leslie W and Estate Of Linda M Mezzell
Bought by
Coffin Donna
Create a Home Valuation Report for This Property
The Home Valuation Report is an in-depth analysis detailing your home's value as well as a comparison with similar homes in the area
Home Values in the Area
Average Home Value in this Area
Purchase History
| Date | Buyer | Sale Price | Title Company |
|---|---|---|---|
| Rodgers Jack S | -- | None Available | |
| Brushwood Allen B | -- | Rtt | |
| Dxq Properties Llc | -- | Rtt | |
| Dxq Properties Llc | -- | None Available | |
| Coffin Donna | -- | Rtt |
Source: Public Records
Mortgage History
| Date | Status | Borrower | Loan Amount |
|---|---|---|---|
| Previous Owner | Brushwood Allen B | $114,675 |
Source: Public Records
Tax History Compared to Growth
Tax History
| Year | Tax Paid | Tax Assessment Tax Assessment Total Assessment is a certain percentage of the fair market value that is determined by local assessors to be the total taxable value of land and additions on the property. | Land | Improvement |
|---|---|---|---|---|
| 2025 | $1,495 | $324,500 | $85,000 | $239,500 |
| 2024 | $1,495 | $312,767 | $85,000 | $242,810 |
| 2023 | $1,495 | $284,334 | $85,000 | $243,606 |
| 2022 | $5,671 | $258,485 | $75,000 | $220,859 |
| 2021 | $5,529 | $234,986 | $60,000 | $174,986 |
| 2020 | $5,775 | $232,560 | $50,000 | $182,560 |
| 2019 | $6,097 | $232,021 | $50,000 | $182,021 |
| 2018 | $5,934 | $220,336 | $50,000 | $173,982 |
| 2017 | $5,394 | $200,305 | $50,000 | $150,305 |
| 2016 | $4,367 | $157,155 | $35,000 | $122,155 |
| 2015 | $2,174 | $137,644 | $30,000 | $107,644 |
Source: Public Records
Map
Nearby Homes
- 404 W Jefferson St
- 107 N Winding Oaks Dr
- 420 W Oak St
- 307 W Brown St
- 111 N Keefer Dr
- 309 Sikorsky Ct
- 115 Pullman Place
- 205 S Cottonbelt Ave
- 410 N Winding Oaks Dr
- 415 Carver Dr
- 300 S Cottonbelt Ave Unit 3A
- 310 Austin Ave
- 423 N Winding Oaks Dr
- 708 Andersonville Ln
- 314 Stephanie St
- 410 Oxford Dr
- 303 N 2nd St
- 315 Celia Cir
- 1022 Debby Ct
- 517 E Gaston Dr
- 417 W Jefferson St
- 413 W Jefferson St
- 414 W Marble St
- 411 W Jefferson St
- 412 W Marble St
- 416 W Marble St
- 419 W Jefferson St
- 410 W Marble St
- 418 W Marble St
- 416 W Jefferson St
- 418 W Jefferson St
- 414 W Jefferson St
- 409 W Jefferson St
- 408 W Marble St
- 420 W Marble St
- 412 W Jefferson St
- 406 W Marble St
- 410 W Jefferson St
- 117 N Winding Oaks Dr
- 300 N Winding Oaks Dr